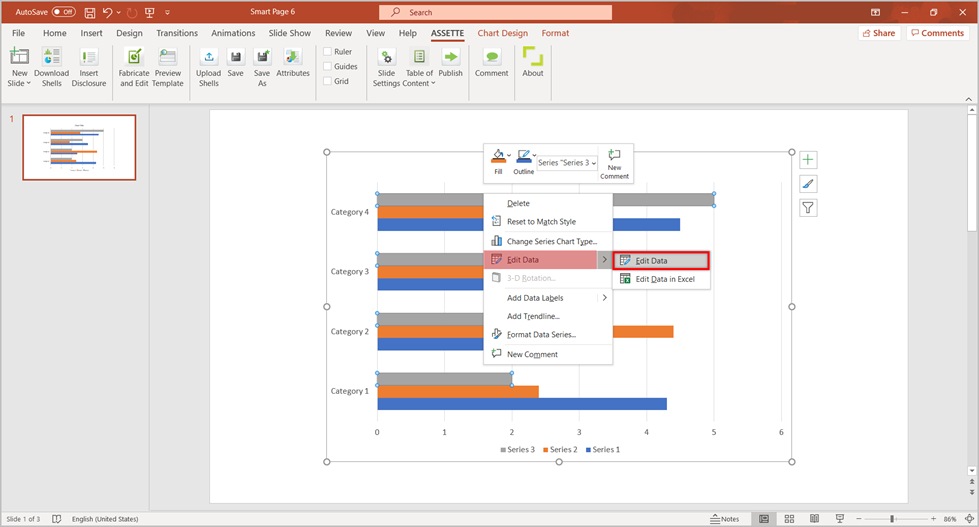
To add new series to charts; line charts, column charts, bar charts, right click on the chart and select Edit Data.
- On the excel panel, drag the last cell in the first row with a series heading to the right and enter a new heading.
Note: In the output, it is the mapped variable that will be displayed for the series and the heading added here will not be displayed. - You can also directly enter a new series heading on the cell next to the last cell with a series in the first row and press Enter key.
When adding a new series, the previously mapped details of the shell are refreshed. Hence, you are required to remap the data including the new series from the Fabricate and Edit panel.