This article makes reference to legacy content and may not be available for all clients. This article is no longer being updated or maintained. Please contact the Assette Client Service Team if you have any questions about this content.
Overview
The Authoring Center is the central location for authoring and managing content across Assette. This section goes into the details of creating and editing Smart Pages and how to fabricate data objects.
1. Create Smart Page
- Click on the Create New option to open a PowerPoint template and create a new Smart Page.
- You will be prompted to open the Assette Editor Launcher.
- Click Open and a PowerPoint template will launch for you to work in.
* Make sure before beginning your work that any other open PowerPoint documents are closed out.
2. Edit Smart Page
- You can edit existing Smart Pages through the edit option.

3. Assette Tab in Ribbon
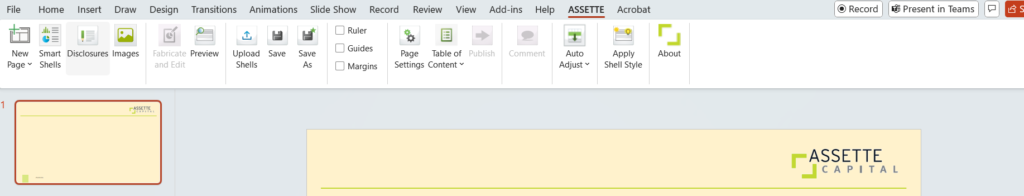
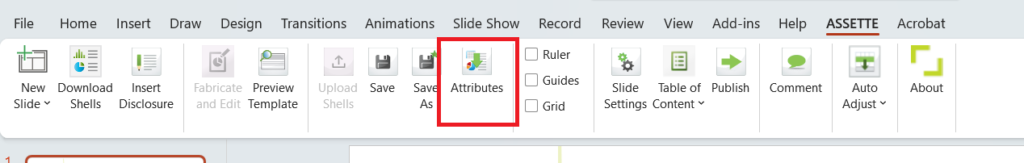
- Assette Editor is ad-on feature developed by Assette to allow clients to fabricate Smart Pages. The Editor appears in the PowerPoint ribbon after installation (see below):
- After fabricating, if the work is incomplete, you can Save and continue on a later time. The work will remain in Draft form.
- If the work is complete, you can Save and Publish and the fabricated and published page will be available for generation purposes with data.
4. Fabricate a Table
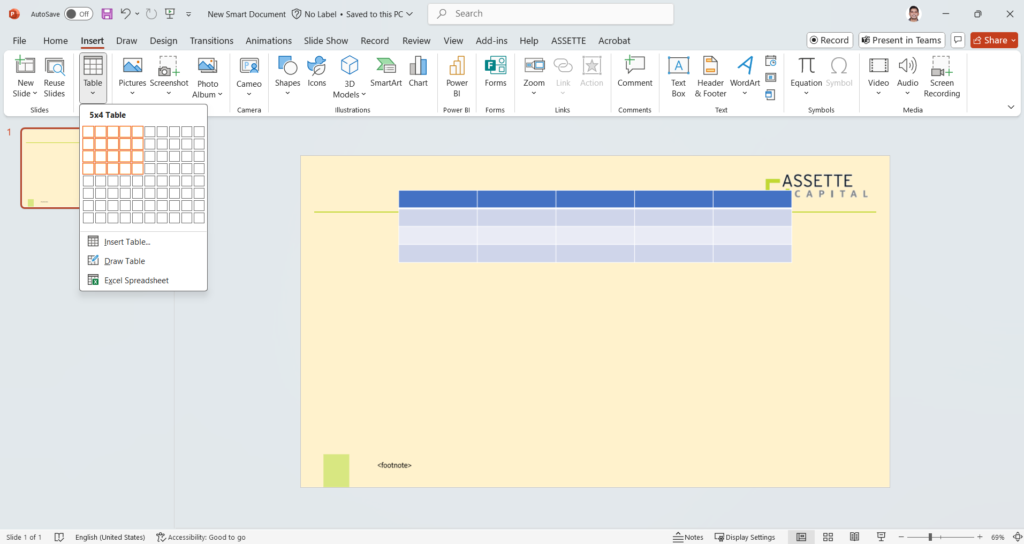
- The first step to Fabricate a Table is to insert a table using basic PowerPoint features.
- Steps: Insert > Table > Select number of rows and columns
- Then select the table drawn and click Fabricate and Edit under the Assette tab in the PowerPoint ribbon.
The Fabricate Panel for the table will be opened by the right edge of the PowerPoint window.
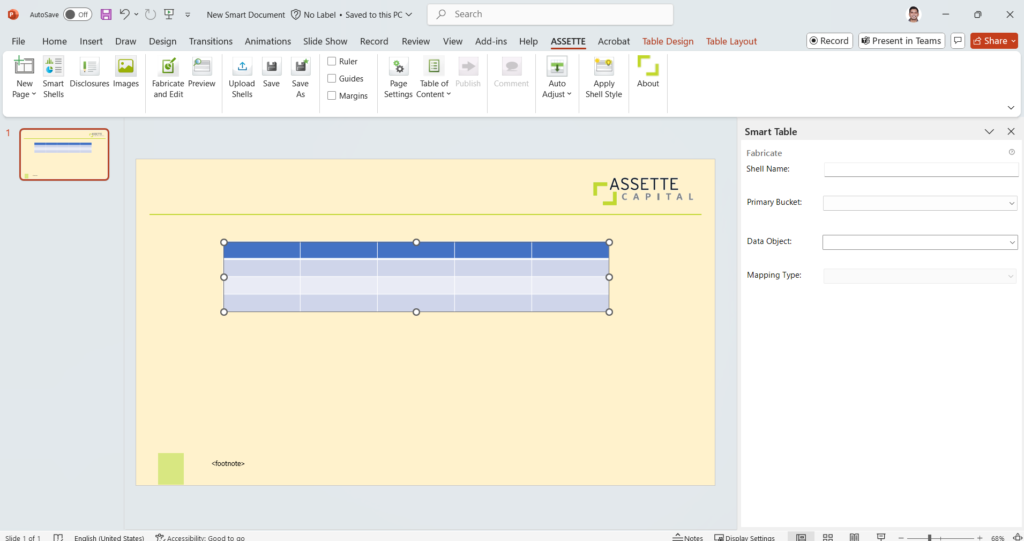
- Enter a Shell Name, and then select the Data Category and Data Object that the table will be created for.
- Once the options are selected, the related Column, Row and Data Settings will be loaded below in the Fabricate Panel.
- Select and update the settings under each tab to reflect the data you wish to display in your output.
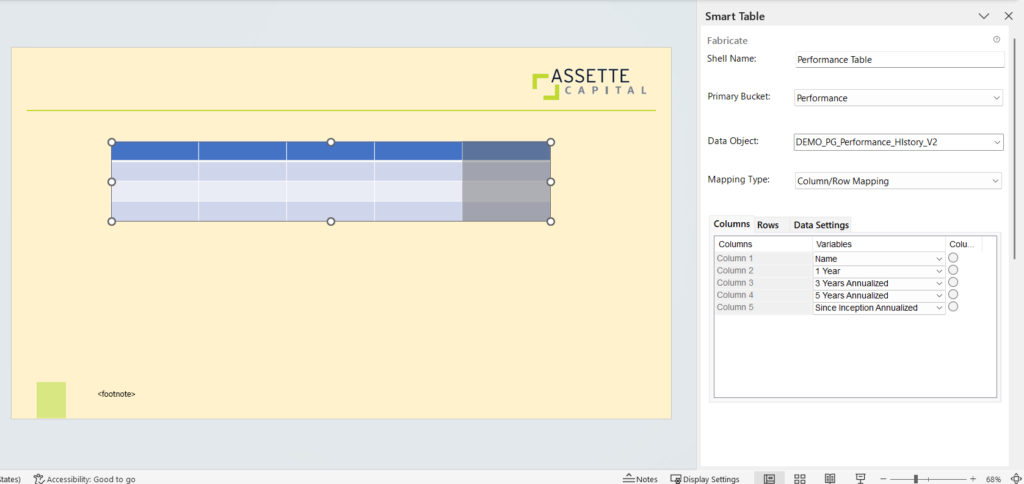
- Mapping Type: Column/Row Mapping
This allows you to map the attributes for columns and rows. You can map the entire column/row in the table.
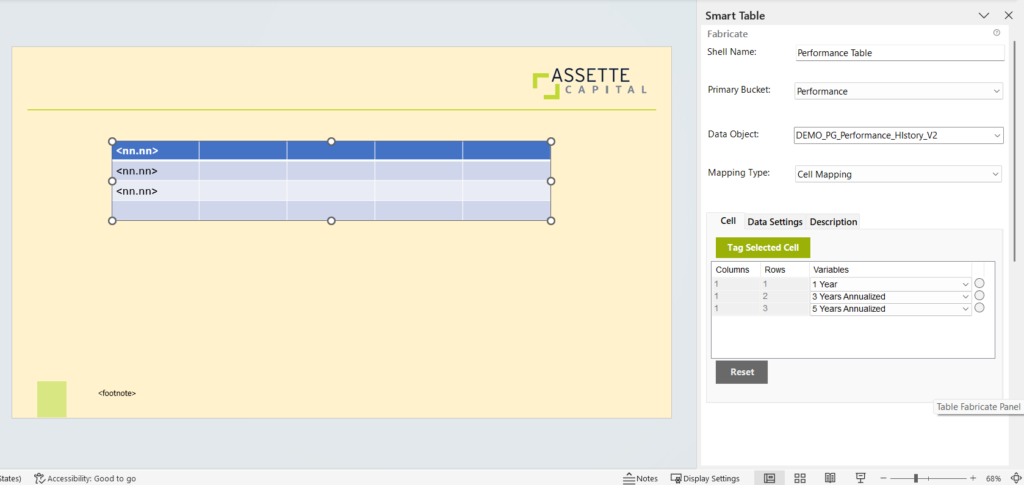
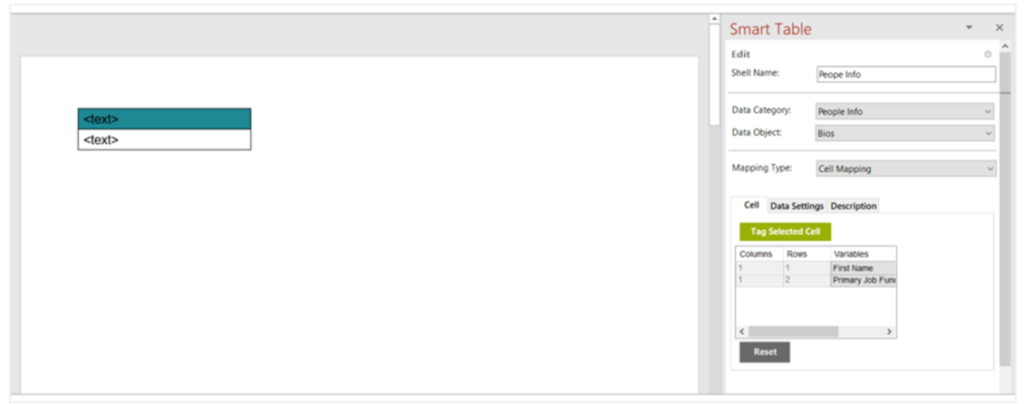
- Mapping Type: Cell Mapping
This allows you to map the attributes for cells. You have to select each cell and tag the attributes as required.
Select the cell and click Tag Selected Cell to tag an attribute to the selected cell.
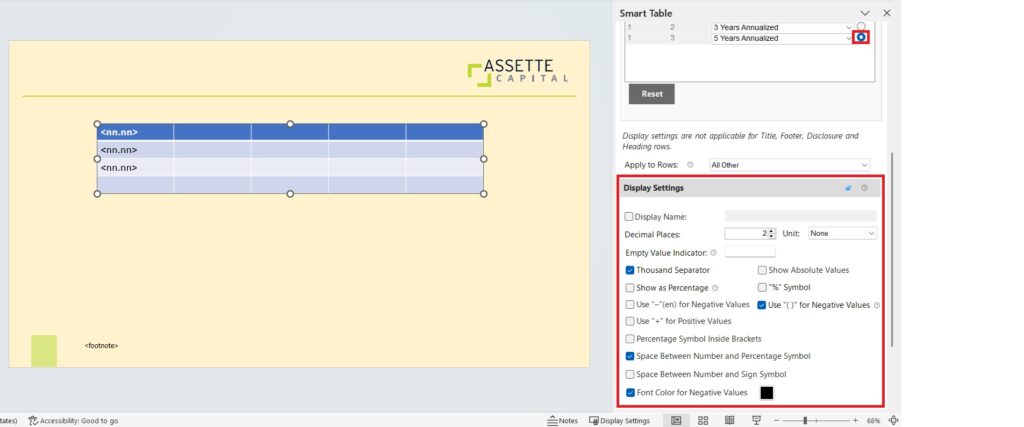
- If you click on the radio button next to each column item, you will be provided with Display Settings where you can specify how the values in the selected column will be displayed. (Display Settings differ based on the attribute type).
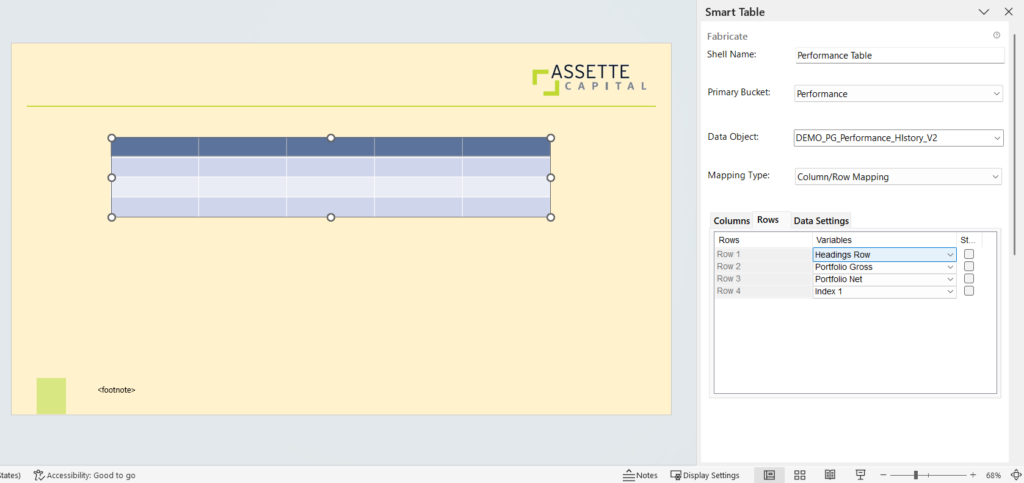
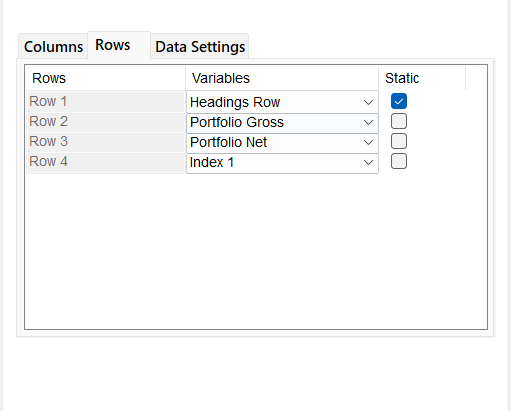
- The check box next to each row under Row tab allows you to add static text to the row instead of variables.
e.g. When you want to have different table headings.
- Once you have completed Column, Row and Data Settings, click on Show Variables to preview tagged variables in the Smart Shell.
- Click Commit to save all settings of the shell.
Note: If Commit is not selected, the changes will not be saved and applied to the shell.
- You can customize the table as required using formatting options in PowerPoint.
e.g. Table design, font size and colors etc. - Make sure to Save the Smart Page to save your work.
- You can Publish the Smart Page to make it available for fabricating Smart Docs.
5. Fabricate a Chart
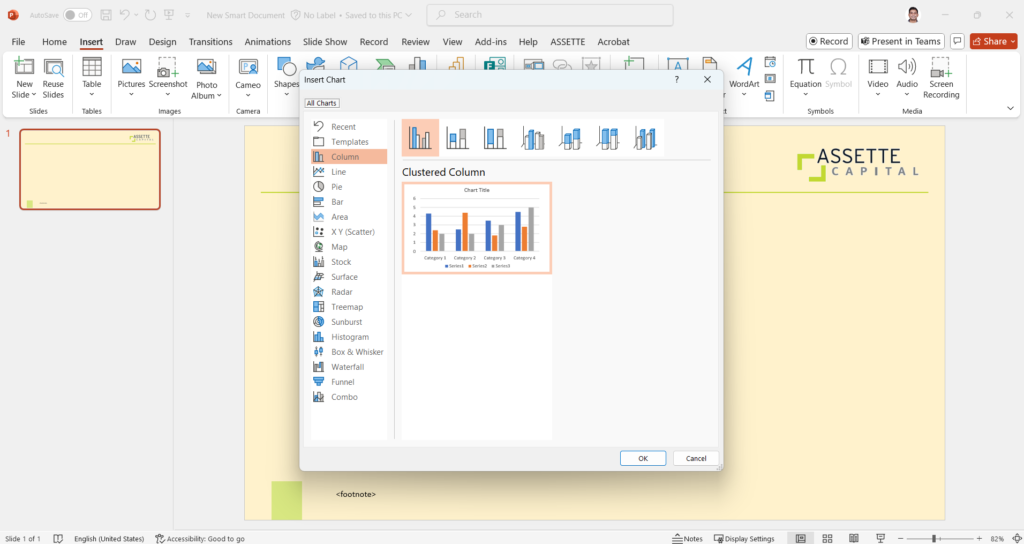
- The first step to Fabricate a Chart is to insert a chart using basic PowerPoint features.
- Steps: Insert > Chart > Select the chart type
- Then select the chart and click Fabricate and Edit under the Assette tab in the PowerPoint ribbon.
The Fabricate Panel for the chart will be opened by the right edge of the PowerPoint window.
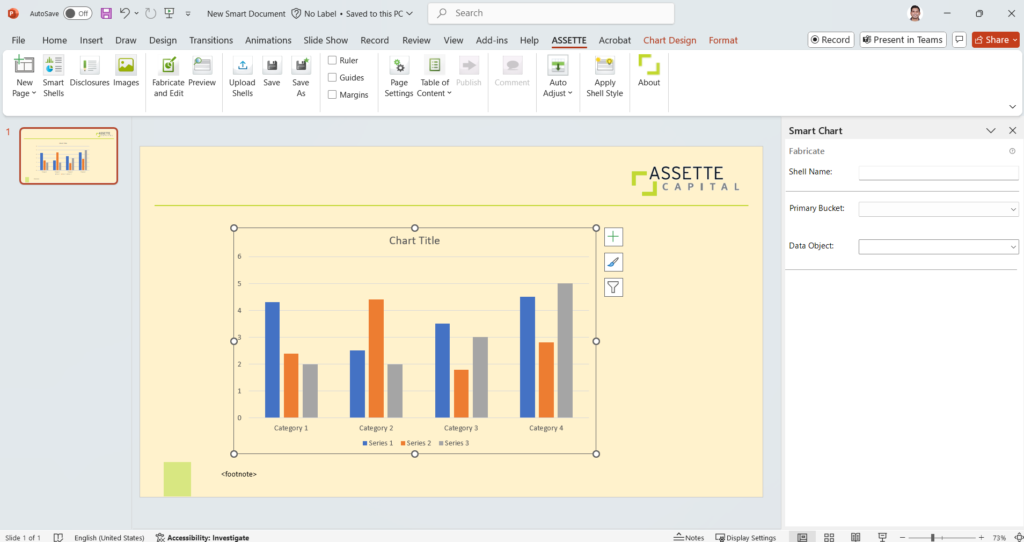
- Enter a Shell Name, and then select the Data Category and Data Object that the chart will be created for.
- Once the options are selected, the related Series, Categories and Data Settings will be loaded below in the Fabricate Panel.
- Select and update the settings under each tab to reflect the data you wish to display in your output.
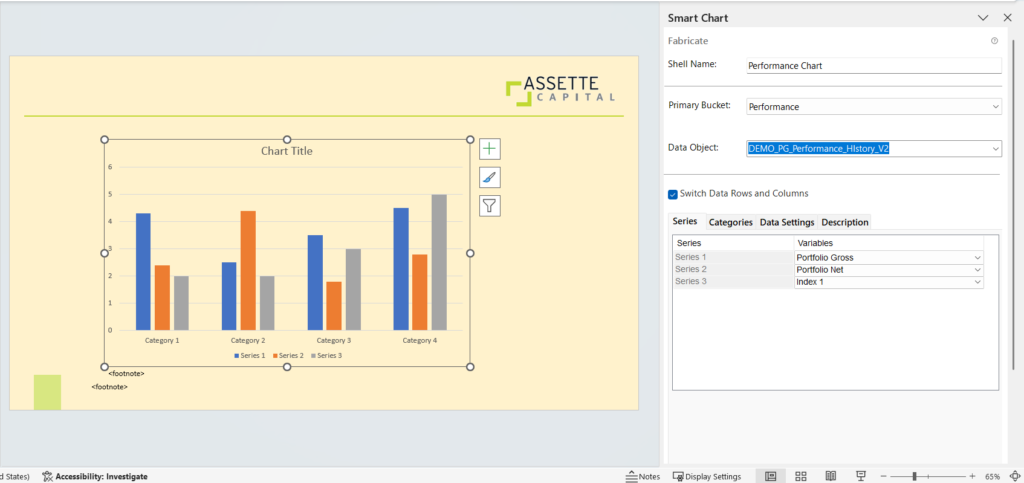
- The check box for Switch Data Rows and Columns allows you to switch the attributes listed under Series and Categories tabs.
- The Series will decide what data the chart shows.
e.g. If you selected Market Value for Series, a sector in the pie chart shows the market value of the selected category. - There can be multiple Series depending on the chart type. e.g. Bar Chart, Line Chart.
- Under Categories you can decide the number of categories and their values.
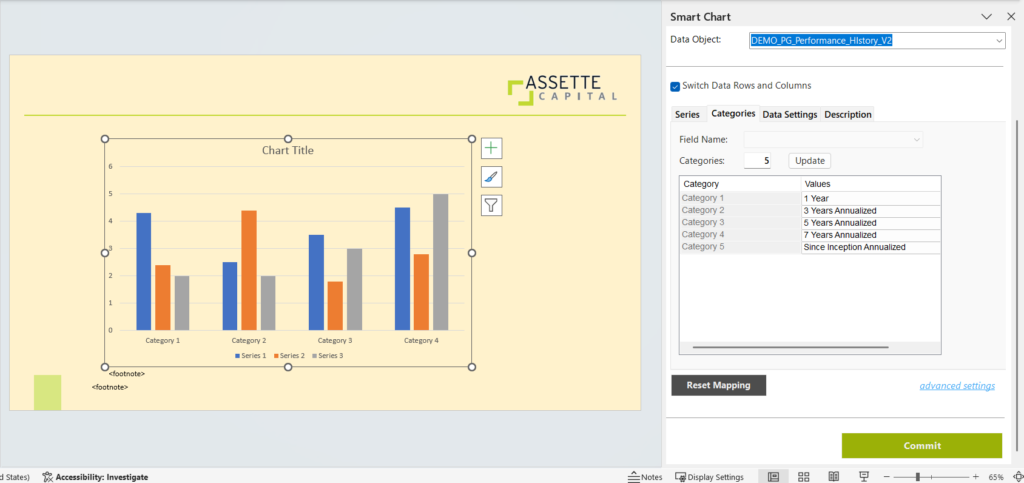
- Under the Data Settings tab, you can configure the data settings based on the selected data object.
- Click on the Refresh button to clear all settings (all mapped details will be removed) and start fresh if required.
- Once you have completed all settings, click Commit to save and apply the details to the Smart Shell.
Note: If Commit is not selected, the changes will not be applied to the shell.
- Make sure to Save the Smart Page to save your work.
- You can Publish the Smart Page to make it available for fabricating Smart Docs.
6. Preview Template
- Once you have fabricated a Smart Shell you can preview the slide with user data. This helps you to make sure that the values in the Smart Shell are correctly mapped as required before publishing the template.
- Click Preview Template in the Assette tab in the PowerPoint ribbon.
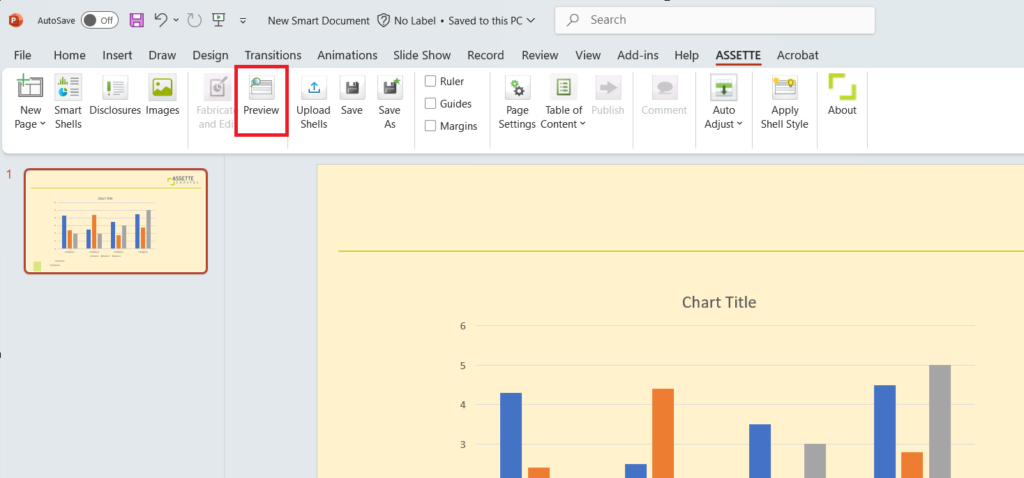
Note: To preview multiple slides with user data, select the required slides while holding CRTL key and then click Preview Template.
- Then the Generation overlay will be opened on a separate tab in your web browser.
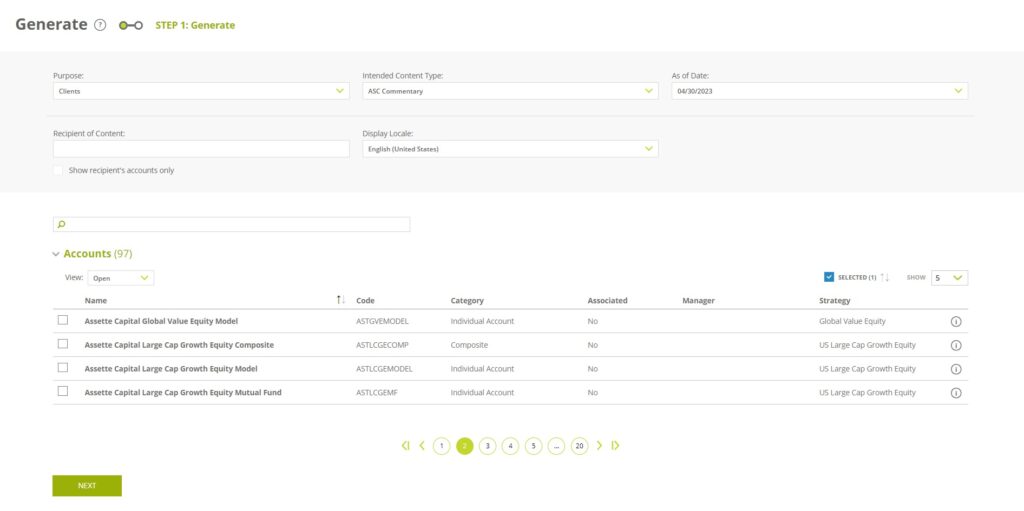
- Enter the generation details and select the account(s) you want to generate output for, then click NEXT.
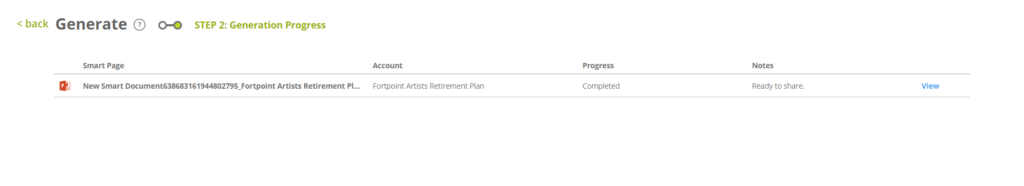
- Once the generation is complete, click VIEW to preview the Smart Page generated for the selected user account.
- You can also preview the saved Smart Page with user data from the Smart Pages index page by selecting Preview with Data from its hamburger menu.
7. Smart Page Attributes
- The Smart Pages you create can be further customized by tagging them with Attributes.
- The available attributes in Assette platform can be modified from Attribute Master in the Admin Center.
- Click on Attributes under Assette tab in the PowerPoint ribbon to navigate to the Specify Attributes overlay.
The Specify Attributes overlay will be launched on a separate tab in your browser.
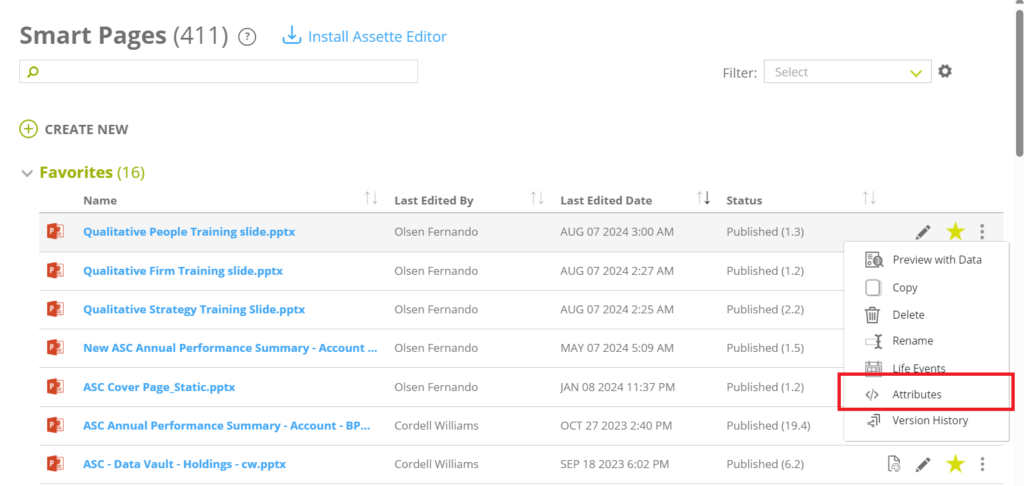
- You can also launch the Specify Attributes overlay from the Smart Pages main page, by selecting Attributes from the hamburger menu of the saved Smart Page.
Then the Specify Attributes overlay will be launched on the same window.
- The attributes are categorized under multiple attribute classes which are separated by tabs in the overlay.
- There are 4 additional attributes provided at the top that you can use to restrict a Smart Page.
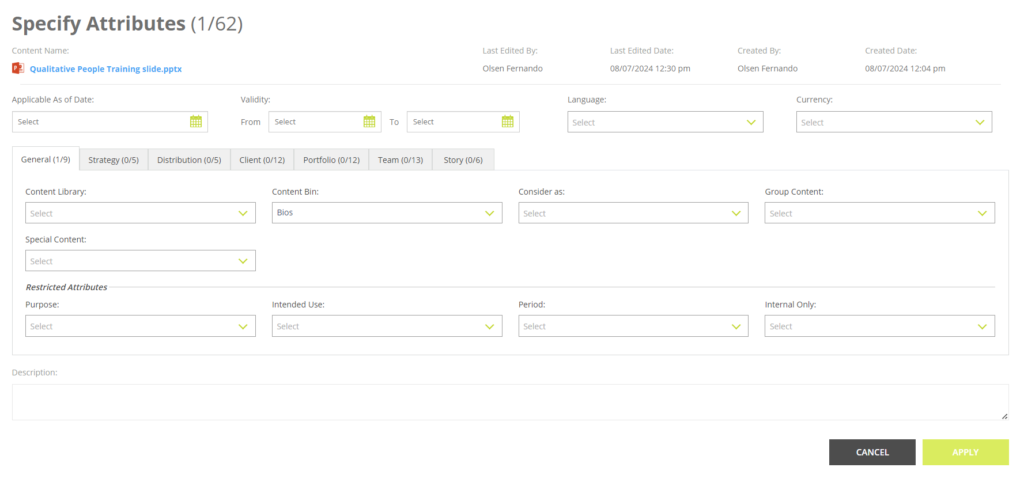
- Applicable As of Date: The As of Date the Smart Doc will relevant to.
If you specify an As of Date, you cannot specify a Validity period for the Smart Page.
Then the Smart Page can only be used for the specified As of Date when generating the output.
If a date is not specified, the Smart Page can be used for any available As of Date. - Validity: The period the Smart Page is valid for.
This allows you to specify a range of As of Dates rather than specifying a single Applicable As of Date.
If you add a Validity period, you cannot specify an Applicable As of Date.
You can specify the period with only From date, To date or limit the range by both.
i.e.
Only From date – The Smart Page is valid for any As of Date starting from the FROM_DATE.
Only To date – The Smart Page is valid for any As of Date until the TO_DATE. - Language: The language the content of the Smart Page will be generated in.
- Currency: The currency which the monetary values in the content of the Smart Page will be generated in.
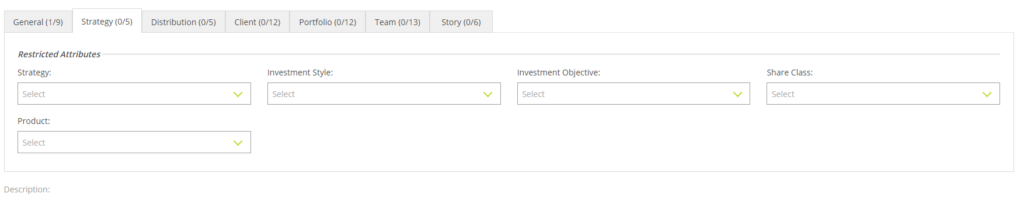
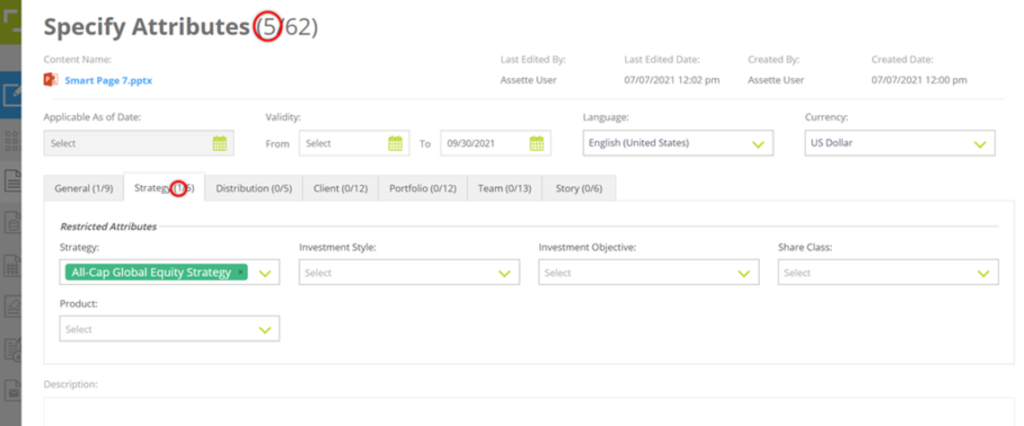
Restricted Attributes
- Restricted Attributes will limit the Smart Page to the specified attribute values.
- These attributes allow you to use the Smart Page only for limited purposes rather than for common use.
e.g. When you tag a specific strategy(s) to the Smart Page, the Smart Page can be used for generating output only for that specified strategy(s).
Note: In the Smart Docs Editor you can disregard the document level restrictions if required.
General Attributes
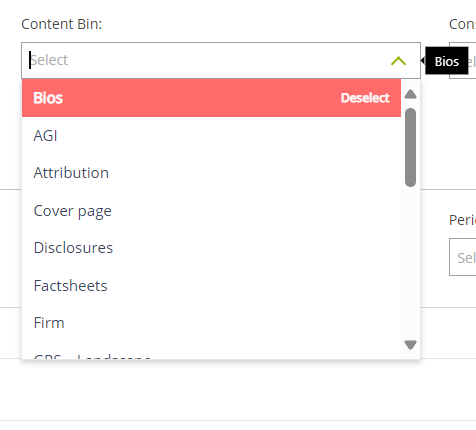
1. Content Bin: To add the Smart Page to a specified Content Bin. You can select only one Content Bin for the Smart Page.
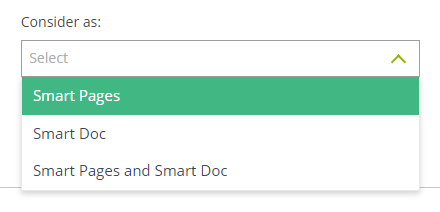
2. Consider as: You can tag a Smart Page as a Smart Doc to directly use the Smart Page for generating output with user data (ie. a factsheet).
You can select only one of the given options for this attribute.
Consider as Smart Pages – The published Smart Page can only be used for fabricating Smart Docs.
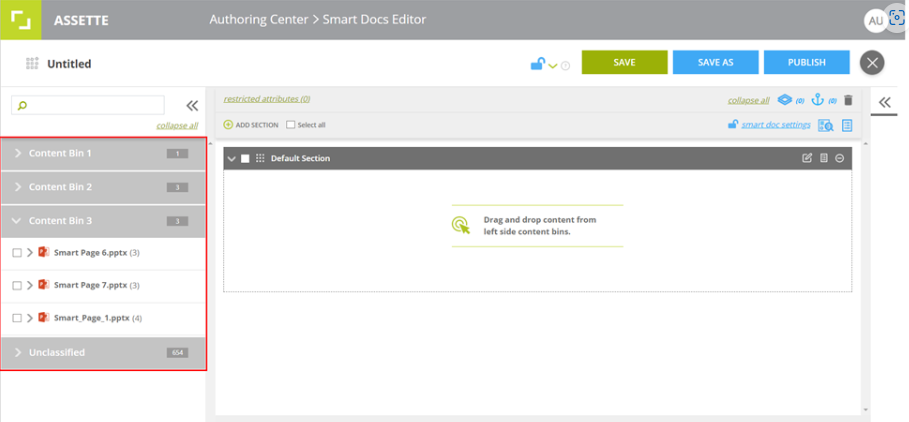
The Smart Page will be available under Content Bins in the Smart Doc Editor.
Consider as Smart Docs – The published Smart Page can only be used for generating ad-hoc and batch output.
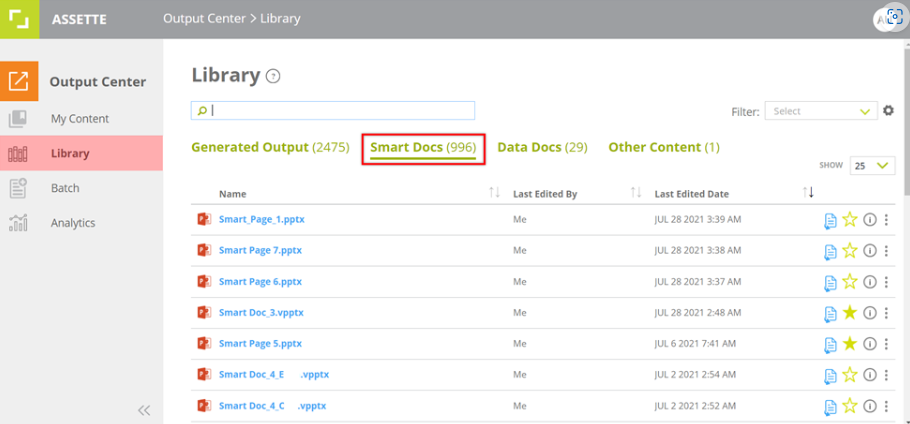
The Smart Page considered as a Smart Doc will be available in the Library in the Output Center for ad-hoc generation and also available for associating to recipients when generating batch outputs.
The Smart Page will not be available for fabricating Smart Docs. Hence, it will not be available under Content Bins in the Smart Doc Editor.
Consider as Smart Page and Smart Doc – The published Smart Page can be used for both fabricating Smart Docs and generating outputs.
The Smart Page will be available under Content Bins in the Smart Doc Editor and also in the Library under Smart Docs in the Output Center.
Note: The published Smart Pages by default are available for fabricating Smart Docs even if the Smart Page is not tagged with any value for this attribute.
3. Group Content: Allows you to group the Smart Page(s) to avoid individual slides being re-ordered or separated from the Smart Doc Editor.
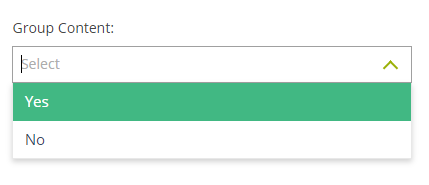
- Yes – All the slides of the Smart Page will be grouped. When grouped you cannot add individual slides separately to the Smart Doc but add the grouped Smart Page as a whole.
You also cannot reorder the slides of the grouped Smart Page in the Smart Doc editor.
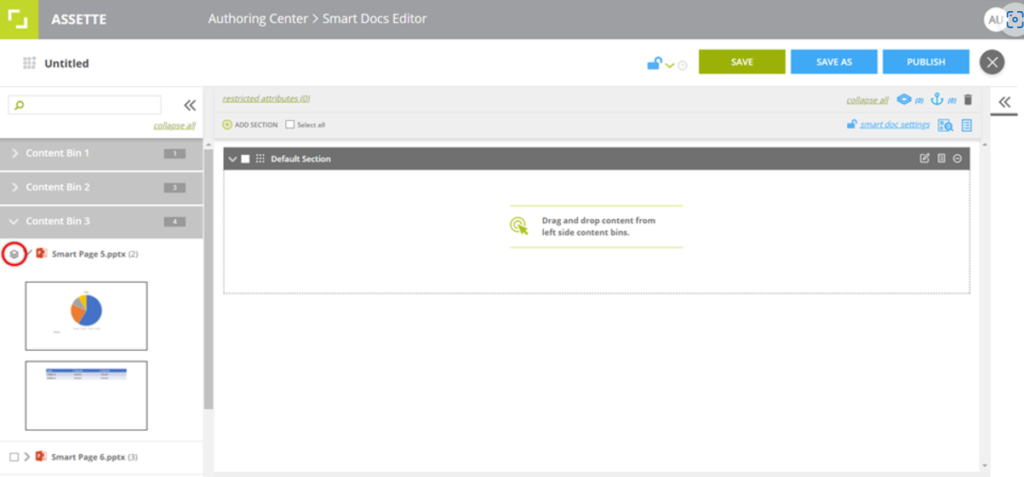
Grouped Smart Pages are marked by icon in the Content Bin.
- No – The slides will not be grouped.
Note: By default the Smart Pages are not grouped.
4. Special Content: To specify special content items.
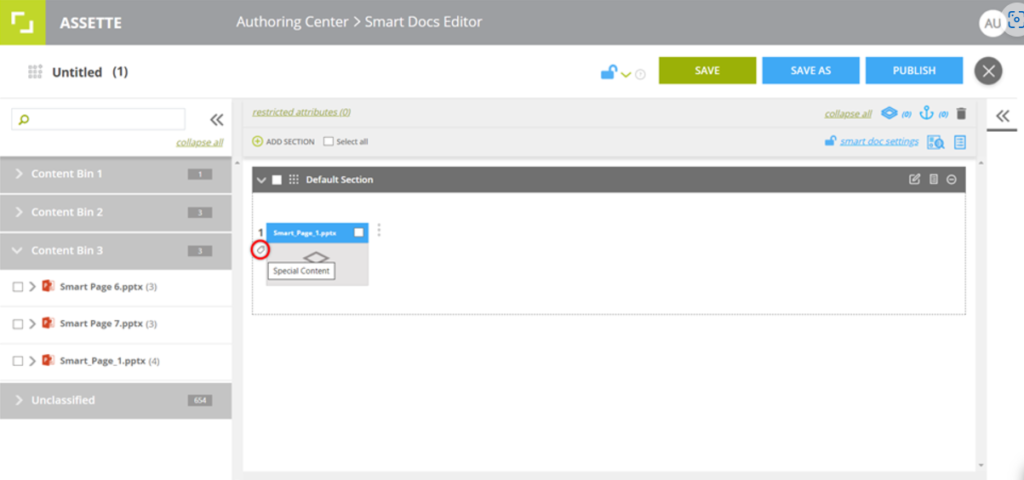
The Smart Pages tagged as a Special Content are marked with the icon in the Smart Doc Editor.
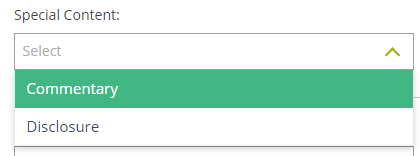
- You can configure the drop-down values for Special Content from the Attribute Master in the Admin Center.
Admin Center->Attribute Master-> Special Content.
- The values in the drop-downs of certain attributes are dynamically loaded based on the values selected for their related attributes.
- You can select multiple values for some attributes. Click back on the selected value in the drop-down to deselect any value if required. You can also click on the x of the selected value to remove/deselect them.
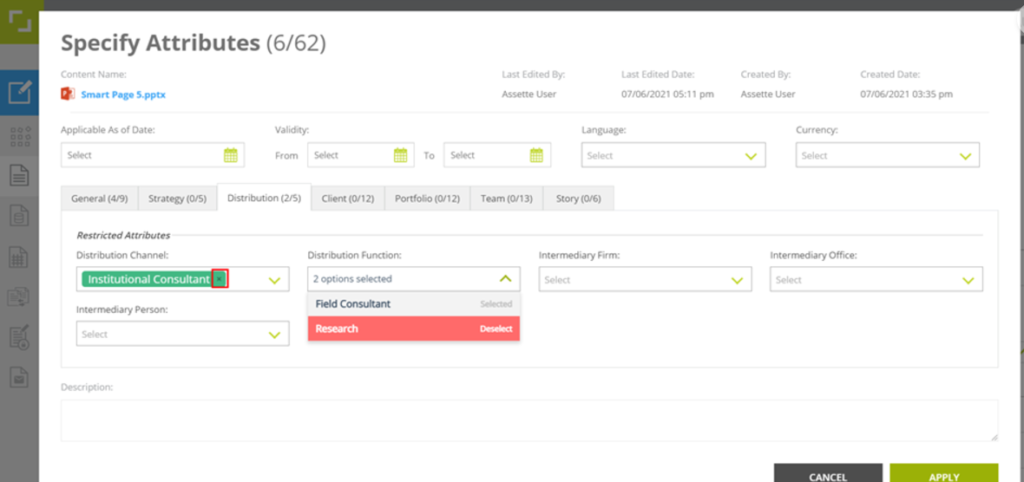
- The number of attributes you have tagged to a Smart Page are mentioned by the main heading and the heading of each tab.

- Once you have tagged the attributes click APPLY.
- If you have navigated to the Specify Attributes overlay from the Assette Editor you are required to click SAVE and save the Smart Page along with its tagged attributes.
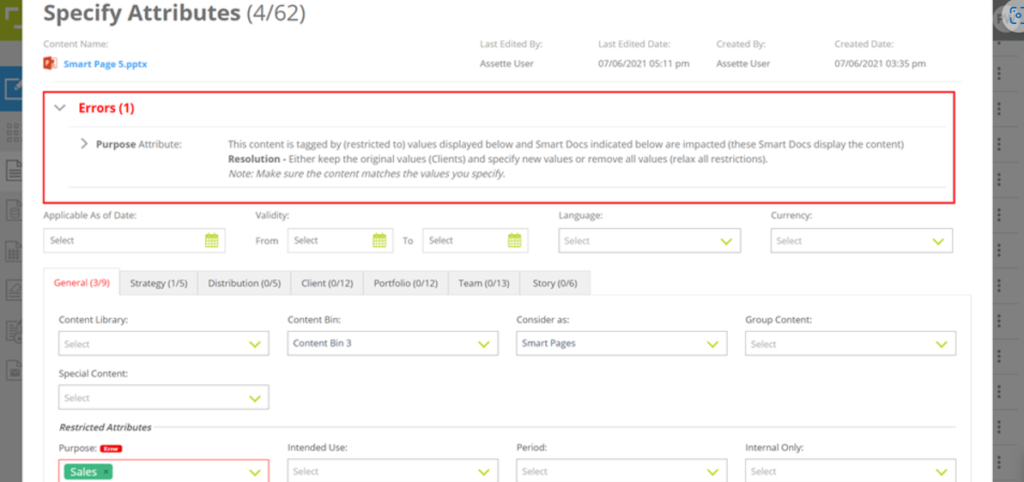
Note: You cannot tag new restricted attributes to the Smart Pages that have already been used to assemble a Smart Doc(s). Nor can you change the previously tagged restricted attribute values.’
However, you can relax all restrictions by removing all values currently tagged to the restricted attribute(s) or tag new value(s) while keeping the original value if it’s a multiselect restricted attribute.
e.g. If the Smart Page has previously been tagged with strategy_1 for Strategy attribute and added to a Smart Doc, you cannot tag new Restricted Attribute to the Smart Page. However you can remove strategy_1 from Strategy attribute or tag a new value, strategy_2 in addition to strategy_1 for Strategy attribute.
9. Advanced Settings – Table
- Select the Smart Table you created and click Fabricate and Edit, then click on advanced settings to open the advanced settings panel.
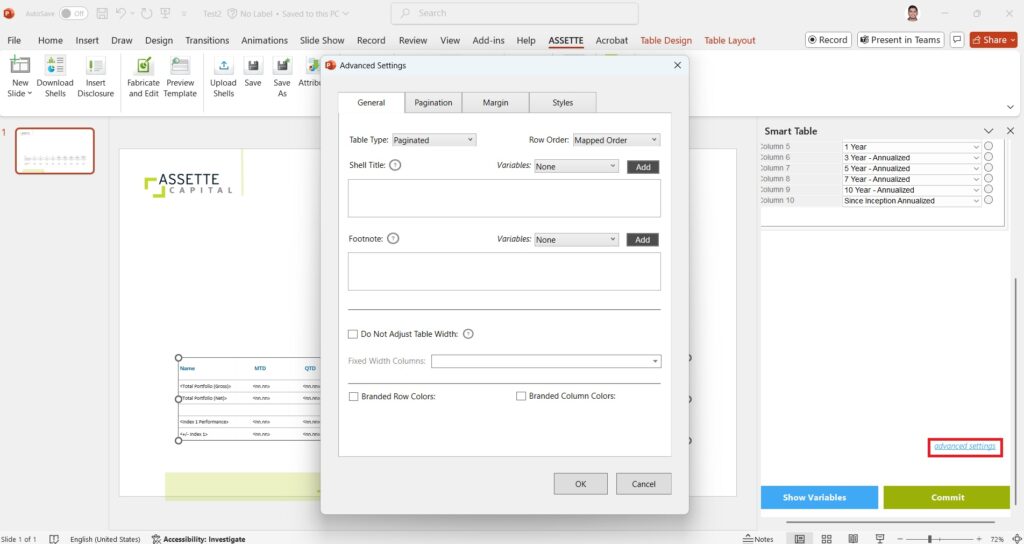
- Make sure to click COMMIT after changing the settings.
- Table type
- Paginated table settings
- Zig zag table settings
- Sibling count
- Branded row/column colors
- Shell Title and Footnote
Table Type
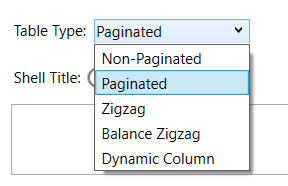
Table type: Defines how the Smart Table will be generated in the output relative to the slide height and width. This is applicable to tables with dynamic rows (the number of rows in the table varies based on the input data settings).
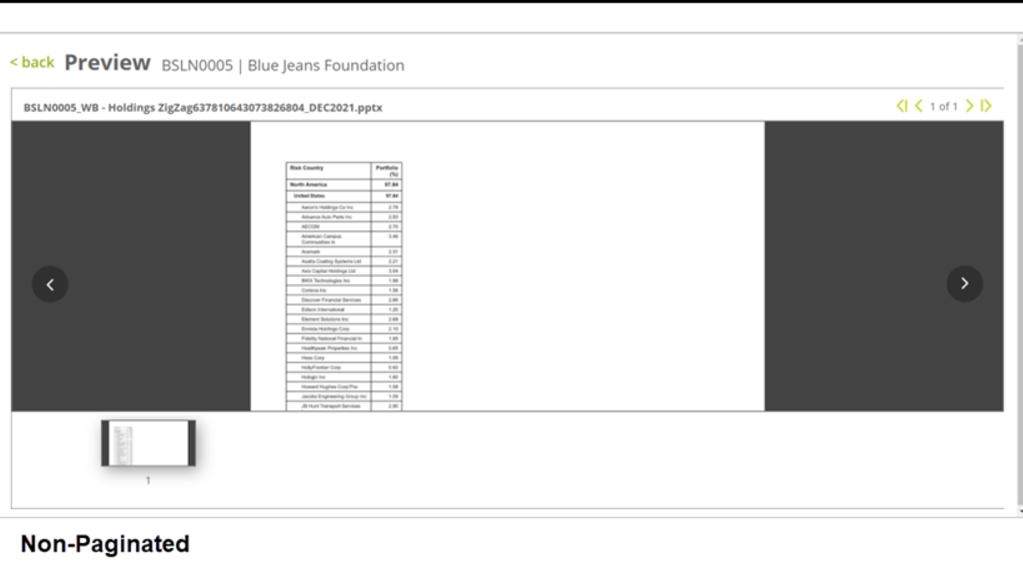
Non-paginated – The table will not be continued on to next pages/slides. If there’s not enough space in the slide to populate all dynamic rows of the table, the table will be cut off at the margin of the current slide.
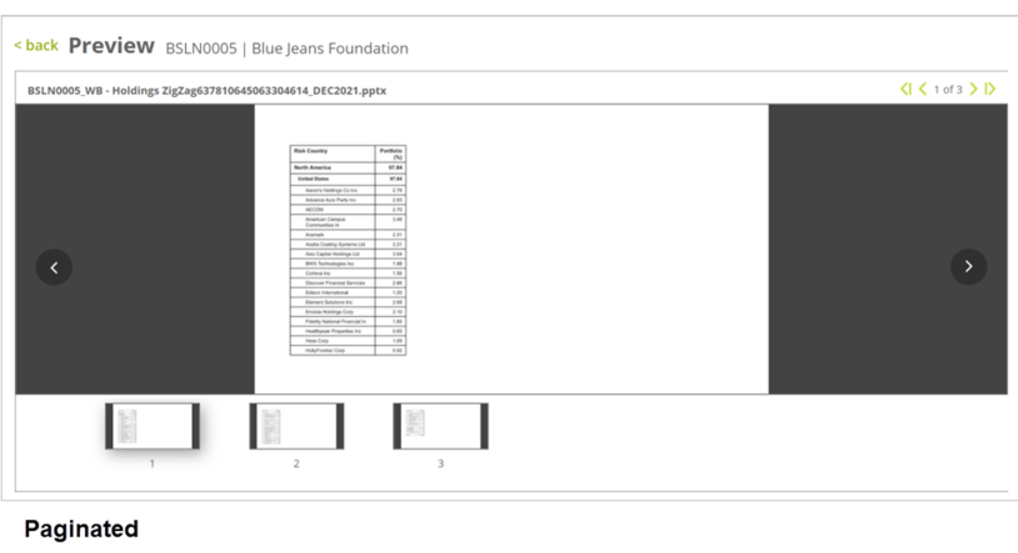
Paginated – The table will be continued on to next pages/slides until all dynamic rows are populated.
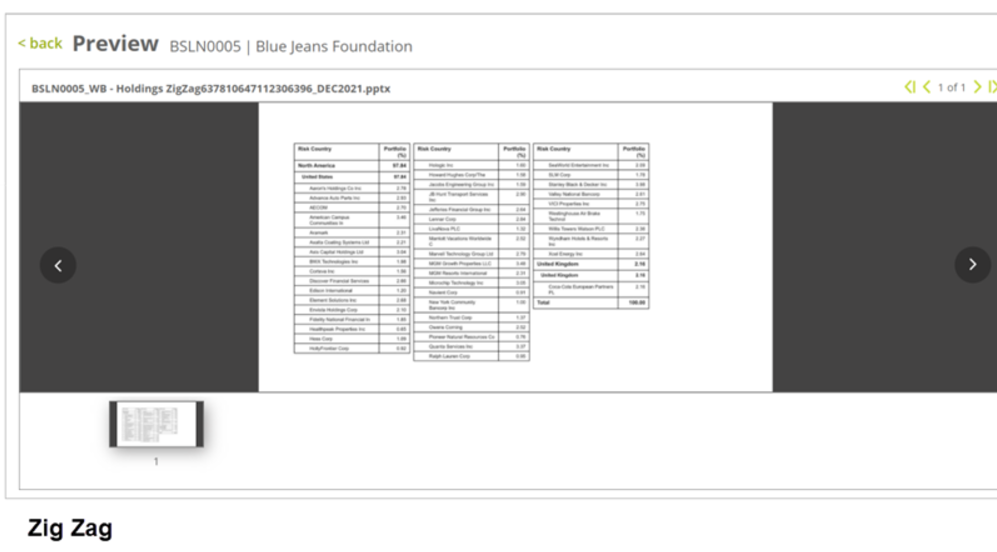
Zig Zag – The table will continue populating the dynamic rows as much as it can within the available slide space from left to right before paginating to the next slide.
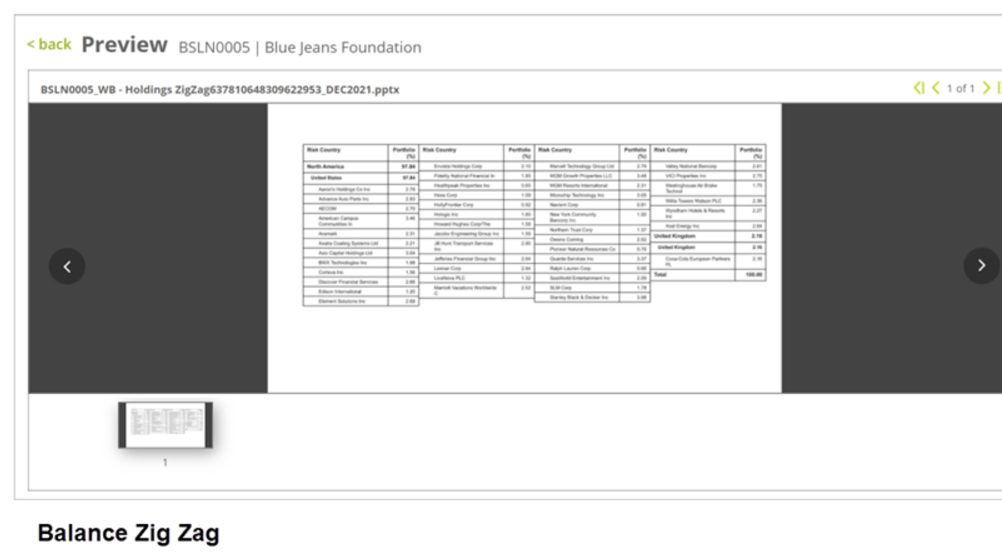
Balance Zig Zag – The tables will be balanced out within the current slide and the rest is continued on to the next slide, so that the tables are at the same level of height within the slide.
E.g., Asset allocation table
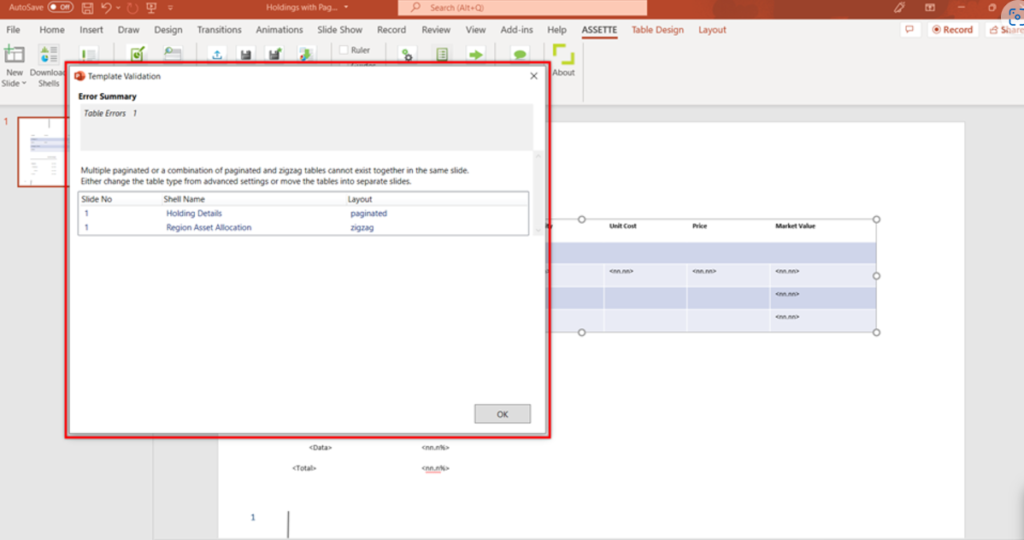
Note: There can only be one paginated/zig zag Smart Shell in a single slide. You cannot publish the Smart Page when there are more than one paginated/zig zag (or balanced zig zag) Smart Shell or any combination of the two in a single slide. (You can Save and Preview with Data but not Publish)
You can change the table type of a Smart Shell in the same slide to ‘non-paginated’ while a second shell remains zig zag or paginated (select the Smart Shell(s) that does not require pagination as the non-paginated shell). Or you can move the zig zag/paginated shells to other slides.
This prevents the content from overlapping on top of each other in the generated outputs.
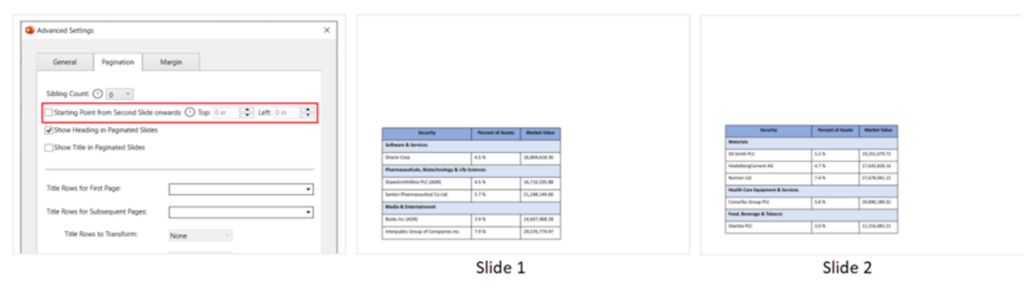
Paginated Table Settings
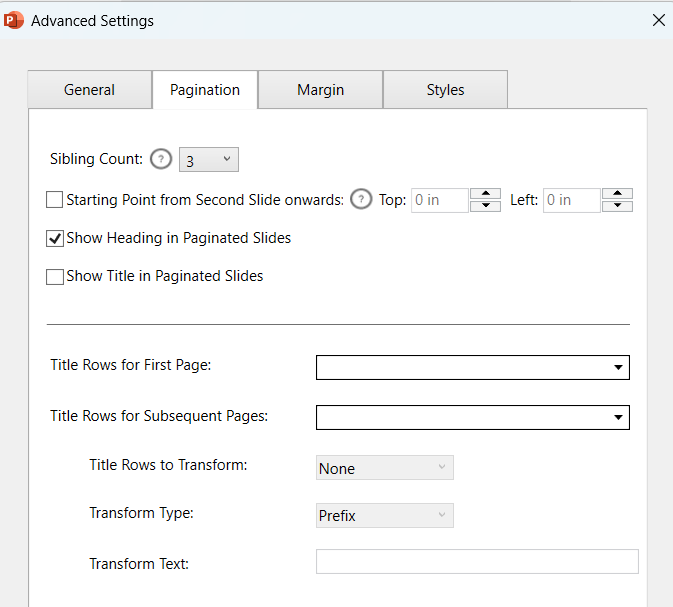
- Starting point from second slide onwards: To specify the starting point of the paginated table from the second slide onward in terms of left and top slide margins.
If left unchecked, the paginated table will be generated at the same point as in the first slide.
E.g., Holdings details table
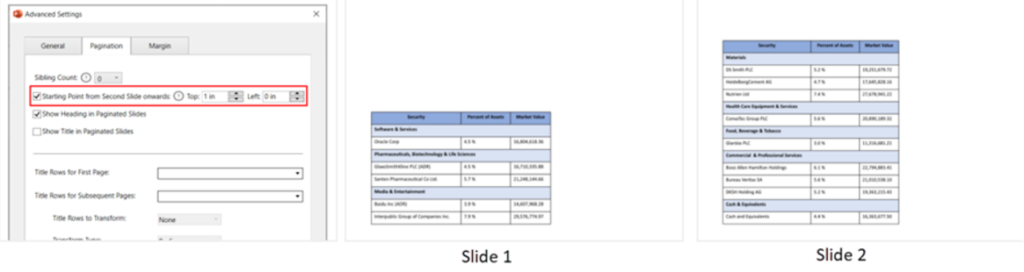
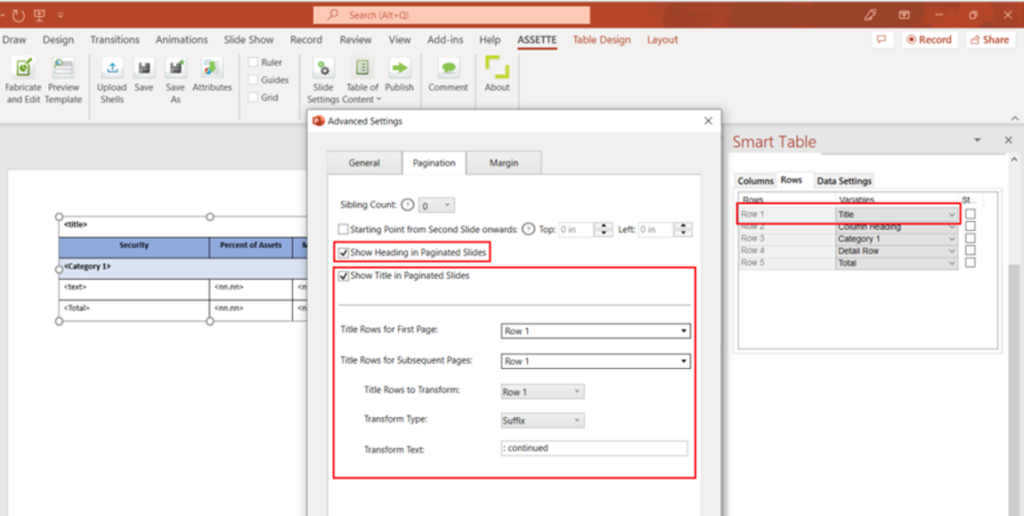
- Show heading in paginated slides: To show the heading-row in each paginated table (the row mapped with the column headings).
- Show title in paginated slides: To show the title-row in each paginated table (the row mapped with the table title).
E.g., Holdings details table

Zig Zag Table Settings
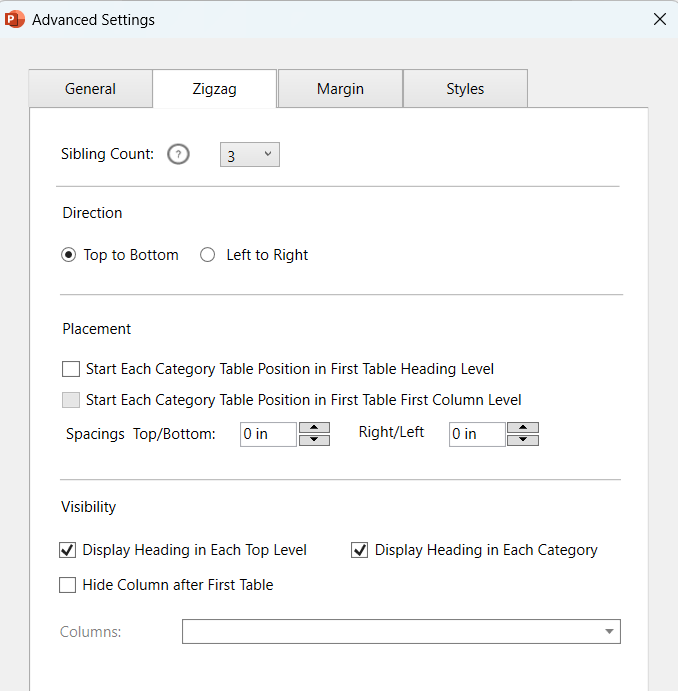
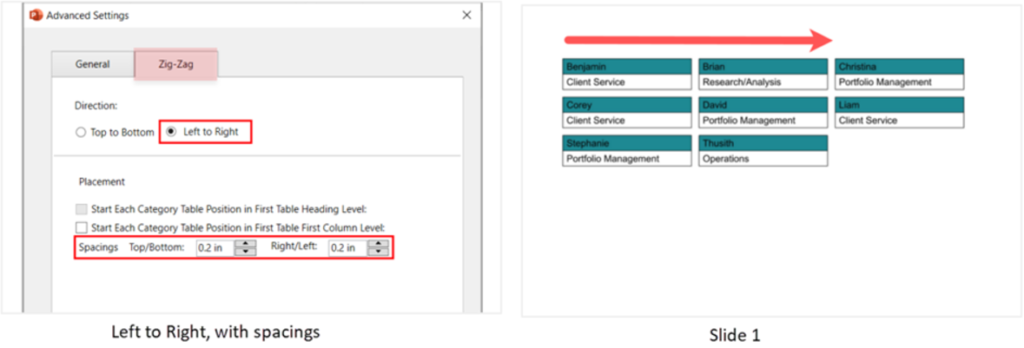
- Direction: Determines the direction in which the data is populated in the table.
Top to bottom: The data is populated from top to bottom of the current table and continue on to the next table in the same direction.
Left to right: The data is populated from the current table to the next table, category wise (from the table in the left to the table in the right). Ideal for tables wired up with qualitative data (e.g., People profiles). - Spacings: To add spacings in between the tables.
E.g., People profile table
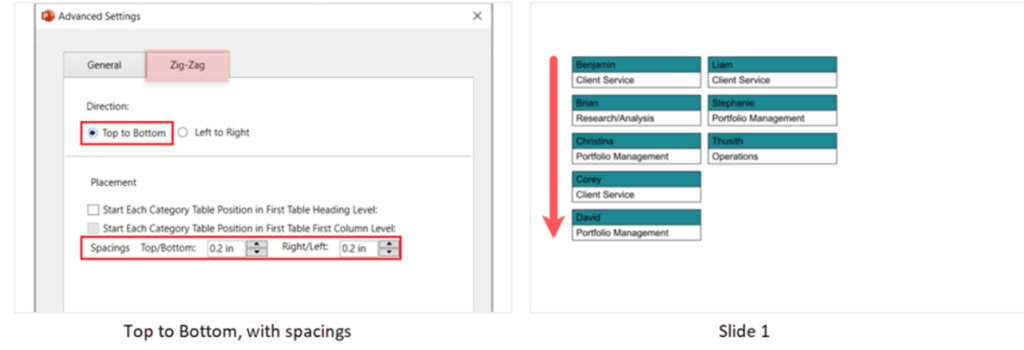
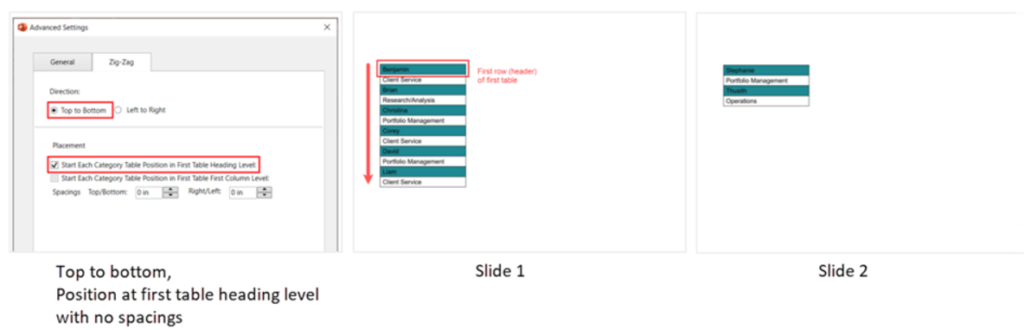
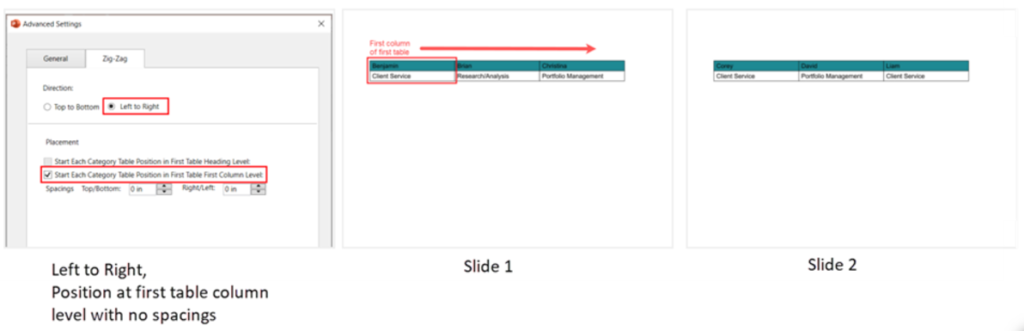
- Placement: Determines the position of each category relative to the heading-row/first row in top-to-bottom tables and first column of the first table in left-to-right tables.
E.g., People profile table
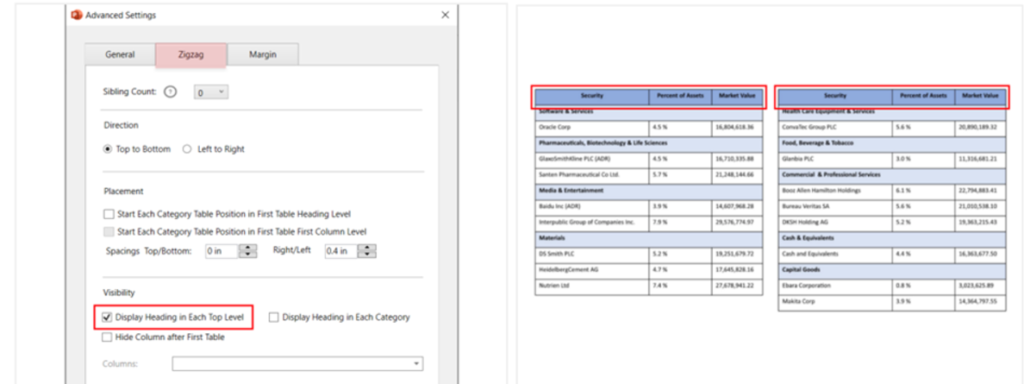
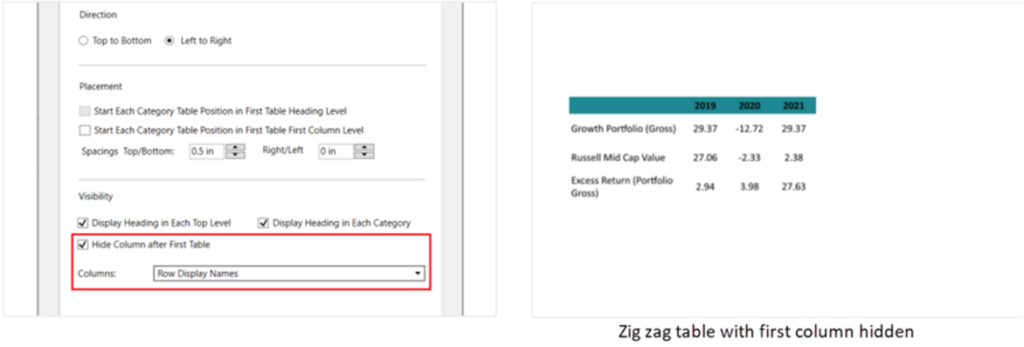
- Visibility: To hide or show headings or specific columns in zig zag tables.
Display heading in each top level: Display the heading-row of the table (table header) at the top of all the tables.
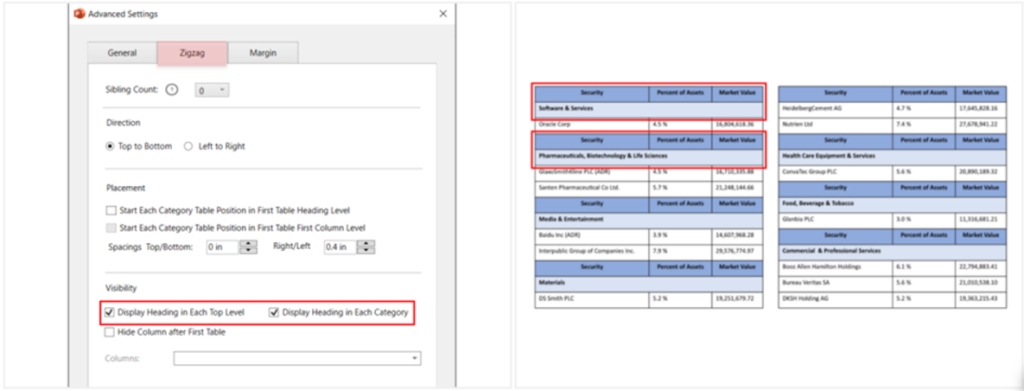
Display heading in each category: To display the table header at the top of each category-row.
E.g., Holdings details table
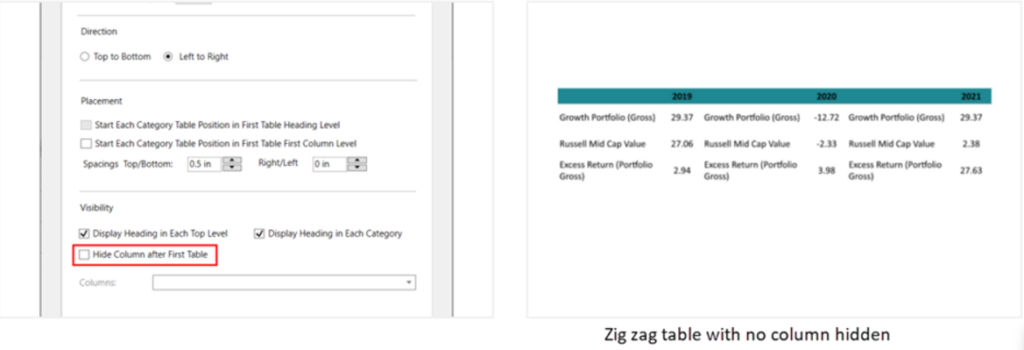
- Hide columns after first table: To hide a column(s) in the tables following the first table.
E.g., Performance by calendar year table
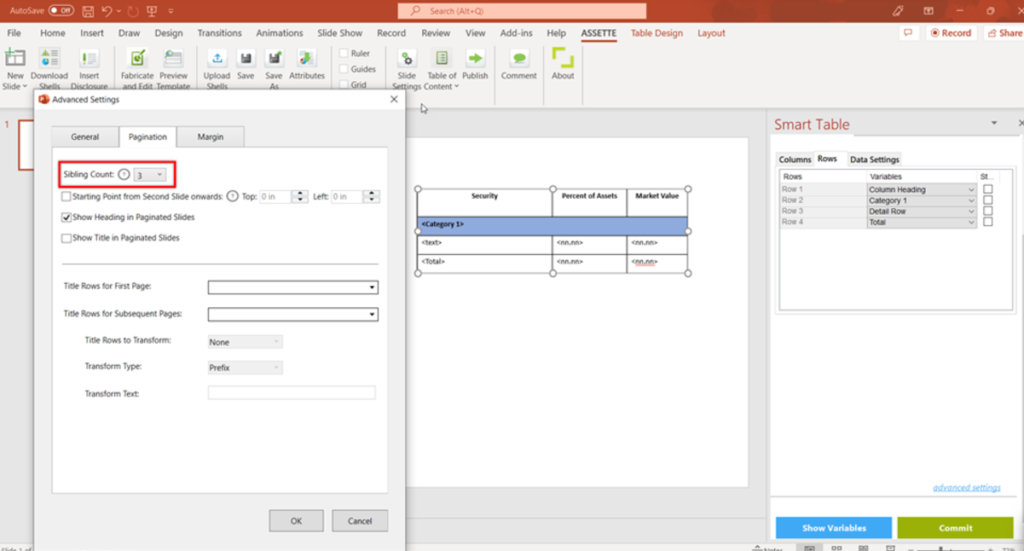
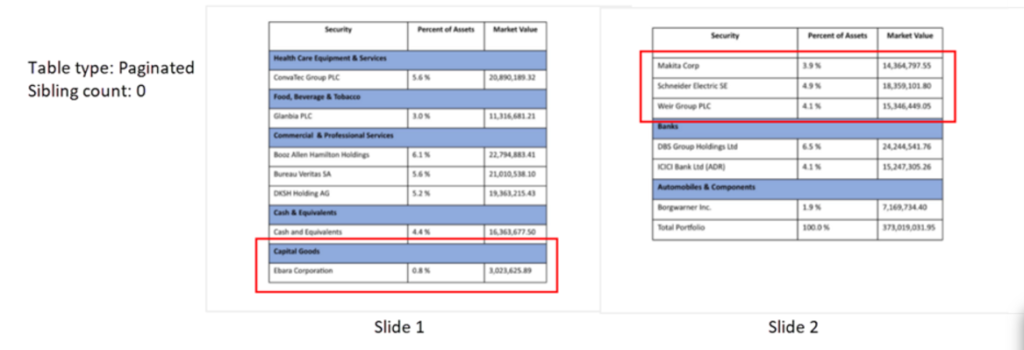
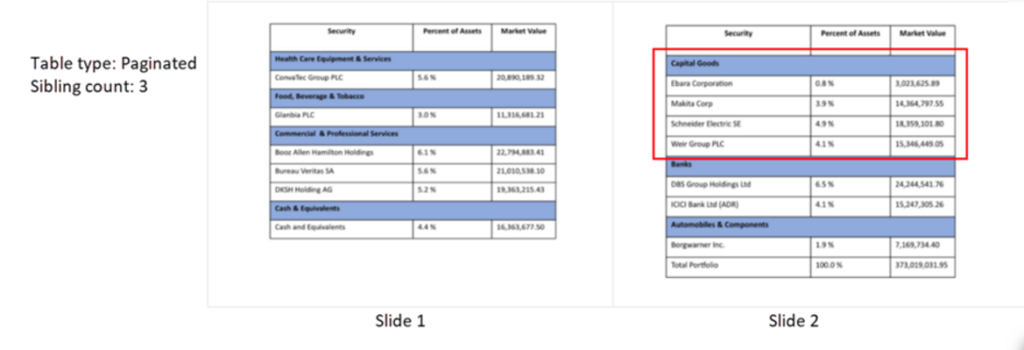
Sibling Count
- Sibling count: The minimum number of detail-rows that should be kept together with the headings/category headings in the paginated or zig zag tables. If there’s not enough room at the bottom of the slide to show the number of rows specified as the sibling count plus the headings/category headings, those rows will be moved to the next slide/page together with their headings/category headings.
E.g., Holding details table
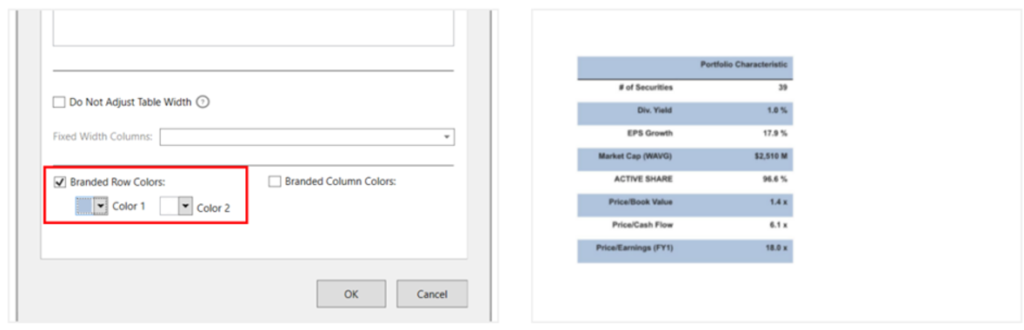
Branded Row/Column Colors
- Branded Row/Column Colors: To specify row/column colors of a selected table.
These colors will override the table design colors/theme colors, but not the colors added via manual customizations to the selected table.
E.g., Portfolio characteristics table
Shell Title and Footnote
- The Data Objects may have a default title and a footnote added from the backend. If you need an alternative title or a footnote to a table/chart you can enter it from the Advanced Settings of the Smart Shell.
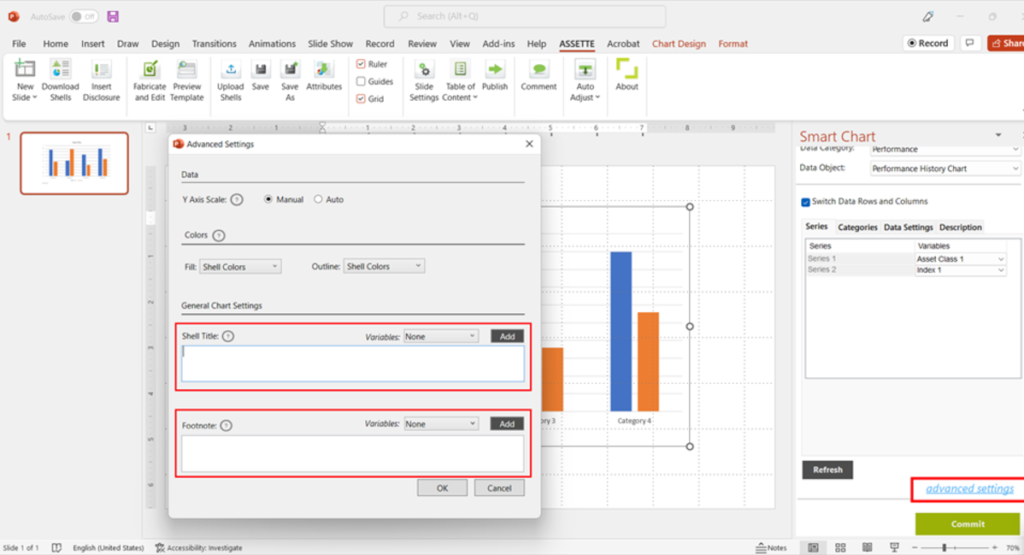
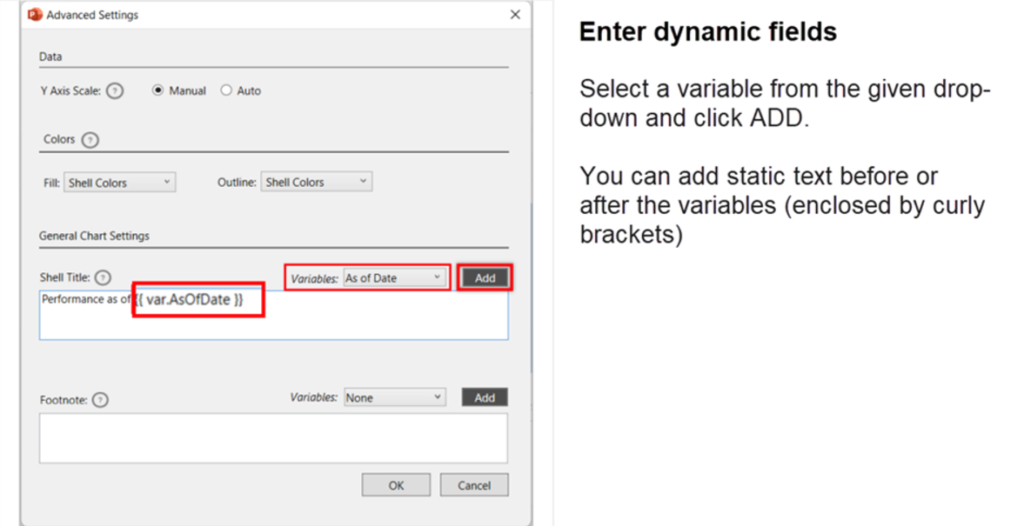
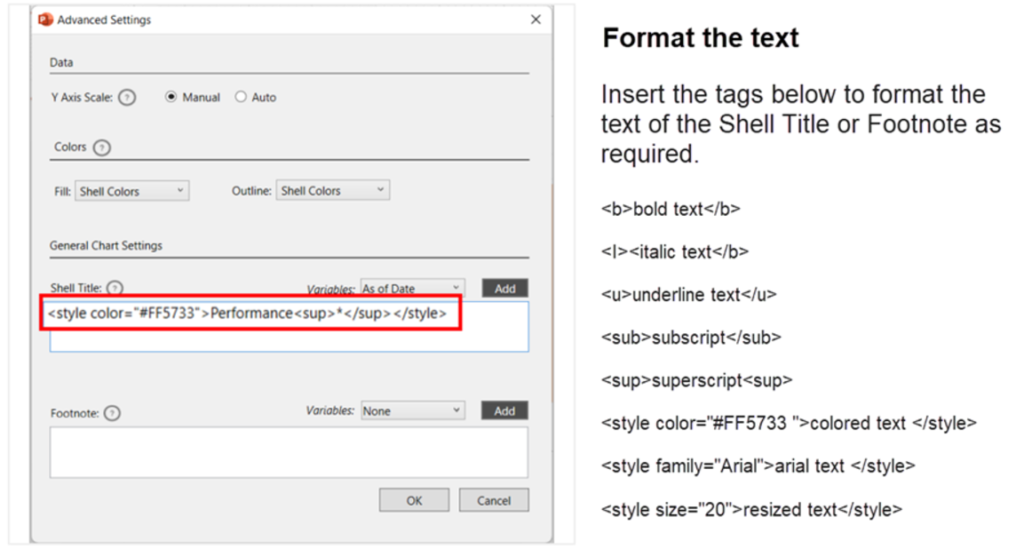
Enter dynamic fields | Format the text #
- Make sure to click COMMIT to save the settings changed in the fabrication panel.
Shell Fill and Outline Colors
- Some data values of the Data Objects are attributed with specific colors in the database. (e.g., color for the benchmark, portfolio, sectors and regions).
- Under the default settings, the Smart Charts that are mapped with such data values are generated with the colors defined for them in the database over the colors defined in the PowerPoint.
- To override the default settings and choose to show the colors defined in the PowerPoint, go to Advanced Settings and select the source of the Fill and Outline Colors of the shell.
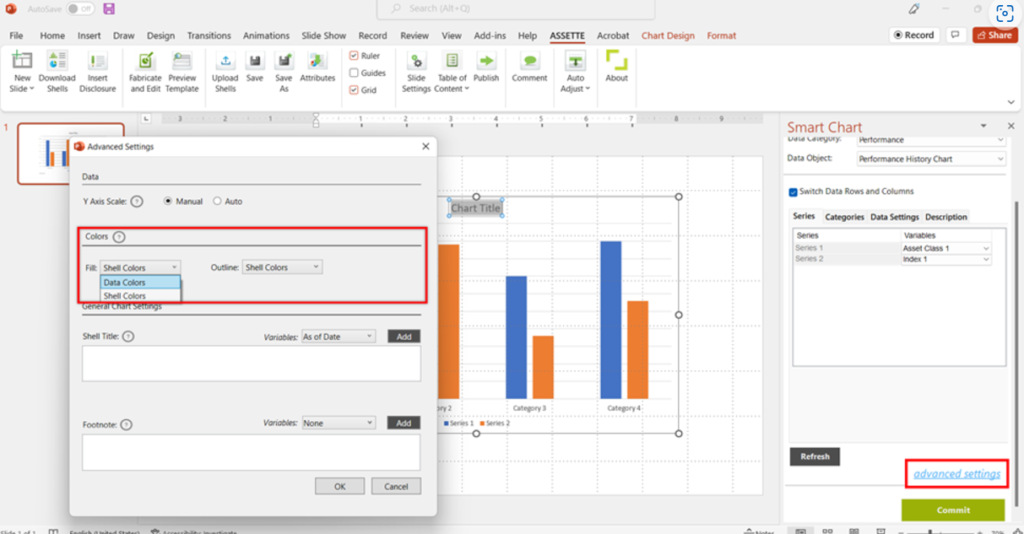
Make sure to click COMMIT to save the settings changed in the fabrication panel.
Shell Colors: The colors defined for the shell in the PowerPoint.
Data Colors: The colors defined in the database for the values shown in the shell. If no colors are defined for the values in the database, the Shell Colors are applied.