This article assumes that a Data Block has already been created to provide data for the table, this article uses a Constant Interface Data Block, which uses static data to simulate a real data source.
Setting up the Correlation Data Block #
Start by setting up a Data Block to extract data from the desired source. This example uses a Constant Interface Data Block which has been named “correlationDemo” to simulate actual data. The Data Block’s “Block Type” and “Definition” must be changed accordingly to retrieve live data.
Data Block General Info #
| Field | Value |
|---|---|
| Name | correlationDemo |
| Block Category | Interface |
| Block Type | Constant |
| Output Type | Data Table |
Data Block Definition #
The following is an example constant data in the “Definition” screen of the Data Block Editor. This section must be updated accordingly if the user wishes to retrieve actual data.
In the following example, the “to” and “from” columns indicate which row-column pair is being compared, while the ‘value’ indicates correlation (or overlap) between the two items.
{
    "data": [
        {
           "from": "Global Strategy",
           "to": "Global Strategy",
           "order": 1,
           "value": 1
        },
        {
           "from": "Global Strategy",
           "to": "Fixed Income Strategy",
           "order": 1,
           "value": 0.01
        },
        {
           "from": "Global Strategy",
           "to": "Equity Strategy",
           "order": 1,
           "value": 0.04
        },
        {
           "from": "Global Strategy",
           "to": "Alternative Investments",
           "order": 1,
           "value": 0.01
        },
         {
           "from": "Global Strategy",
           "to": "Balanced Strategy",
           "order": 1,
           "value": 0.04
        },
        {
           "from": "Fixed Income Strategy",
           "to": "Global Strategy",
           "order": 2,
           "value": 0.01
        },
        {
           "from": "Fixed Income Strategy",
           "to": "Fixed Income Strategy",
           "order": 2,
           "value": 1
        },
        {
           "from": "Fixed Income Strategy",
           "to": "Equity Strategy",
           "order": 2,
           "value": 0.09
        },
        {
           "from": "Fixed Income Strategy",
           "to": "Alternative Investments",
           "order": 2,
           "value": 0.12
        },
         {
           "from": "Fixed Income Strategy",
           "to": "Balanced Strategy",
           "order": 2,
           "value": 0.06
        },
        {
           "from": "Equity Strategy",
           "to": "Global Strategy",
           "order": 3,
           "value": 0.04
        },
        {
           "from": "Equity Strategy",
           "to": "Fixed Income Strategy",
           "order": 3,
           "value": 0.09
        },
        {
           "from": "Equity Strategy",
           "to": "Equity Strategy",
           "order": 3,
           "value": 1
        }
        ,
        {
           "from": "Equity Strategy",
           "to": "Alternative Investments",
           "order": 3,
           "value": 0.04
        } ,
        {
           "from": "Equity Strategy",
           "to": "Balanced Strategy",
           "order": 3,
           "value": 0.00
        },
        {
           "from": "Alternative Investments",
           "to": "Global Strategy",
           "order": 4,
           "value": 0.01
        },
        {
           "from": "Alternative Investments",
           "to": "Fixed Income Strategy",
           "order": 4,
           "value": 0.12
        },
        {
           "from": "Alternative Investments",
           "to": "Equity Strategy",
           "order": 4,
           "value": 0.04
        }
        ,
        {
           "from": "Alternative Investments",
           "to": "Alternative Investments",
           "order": 4,
           "value": 1
        },
      {
           "from": "Alternative Investments",
           "to": "Balanced Strategy",
           "order": 4,
           "value": 0.17
        },
        {
           "from": "Balanced Strategy",
           "to": "Global Strategy",
           "order": 5,
           "value": 0.04
        },
        {
           "from": "Balanced Strategy",
           "to": "Fixed Income Strategy",
           "order": 5,
           "value": 0.06
        },
        {
           "from": "Balanced Strategy",
           "to": "Equity Strategy",
           "order": 5,
           "value": 0.00
        }
        ,
        {
           "from": "Balanced Strategy",
           "to": "Alternative Investments",
           "order": 5,
           "value": 0.17
        },
          {
           "from": "Balanced Strategy",
           "to": "Balanced Strategy",
           "order": 5,
           "value": 1
        }
    ],
    "errors": [],
    "success": true,
    "logs": []
}
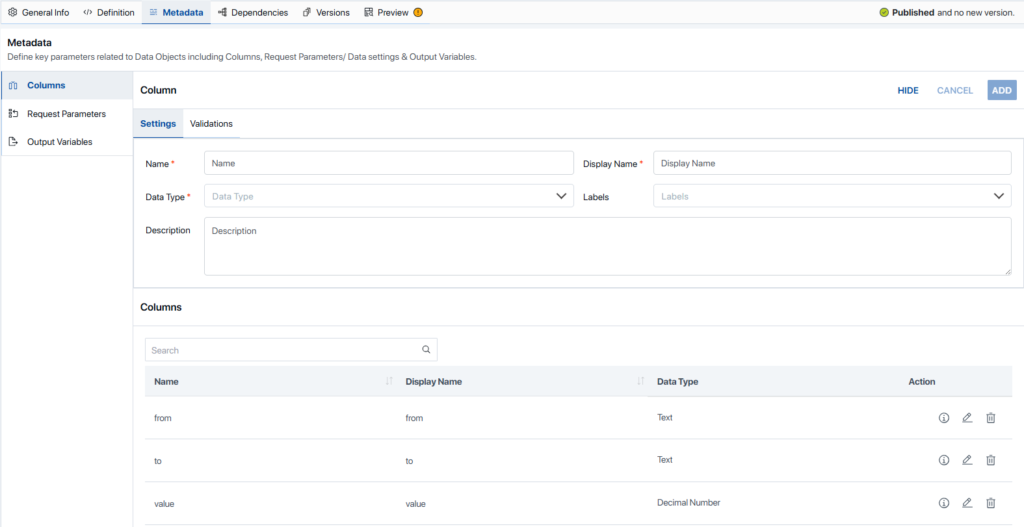
Data Block Metadata #
Create 3 columns “to”, “from” and “value” as shown below, to correspond with the keys provided in the Data Block’s definition. Ensure that the “Data Type” for each column is done correctly. If the name of the keys have been changed in the Data Block’s definition, ensure that the values have been updated to match here.
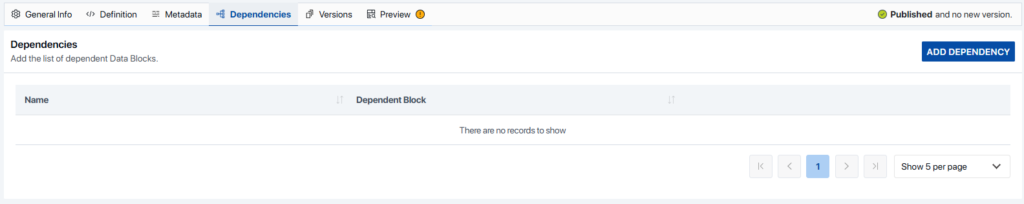
Dependencies #
Since the Data Block in this example is a Constant Data Block, there are no dependencies. However, in a live version, it is expected to have at least one dependency. Ensure that the correct dependencies have been included to support any customizations.
Create the Correlation Data Object #
Once the Data Block has been created to provide data to the Data Object for the correlation table, users must next create a Data Object to handle the formatting of the data before it can be made available for the Smart Shell and in turn, Smart Pages.
General Info #
Begin by creating a Data Object and setting up the General Info tab as shown below. As with the Data Block, the “Display Name” and “Name” may be anything the user would like, but the “Usage” and “Use for” must be exactly as shown below.
| Field | Value |
|---|---|
| Display Name | Correlation Demo |
| Name | correlationDemo |
| Usage | Library |
| Use for | Table |
Data Source #
Next, select the Data Block created in the previous steps, “correlationDemo”.
| Field | Value |
|---|---|
| Retrieve Data From | Data Blocks |
| Data Block Name | correlationDemo |
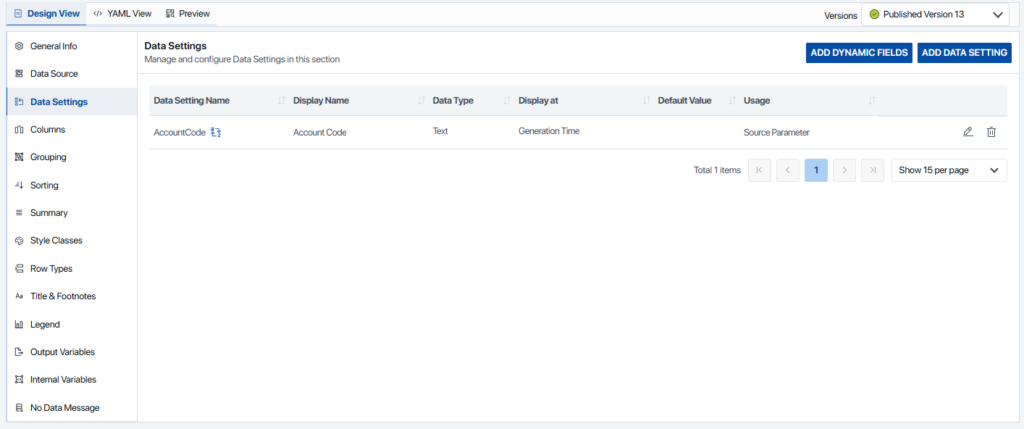
Data Settings Tab #
In this example, we will set up Account Code as a Data Setting. However, depending on the setup of the Data Block, additional Data Settings may be required.
To set up the Account Code Data setting, use the “Add Dynamic Fields” button in the upper left corner, and select “AccountCode”. For more information on Dynamic Fields, see Data Settings Tab.
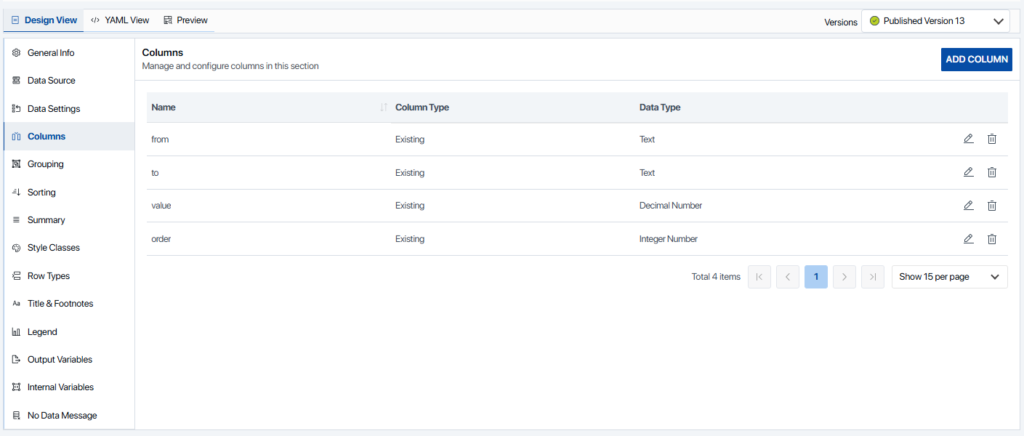
Columns Tab #
In this example, all columns should be “existing” as they are sourced directly from the Data Block, and do not require editing.
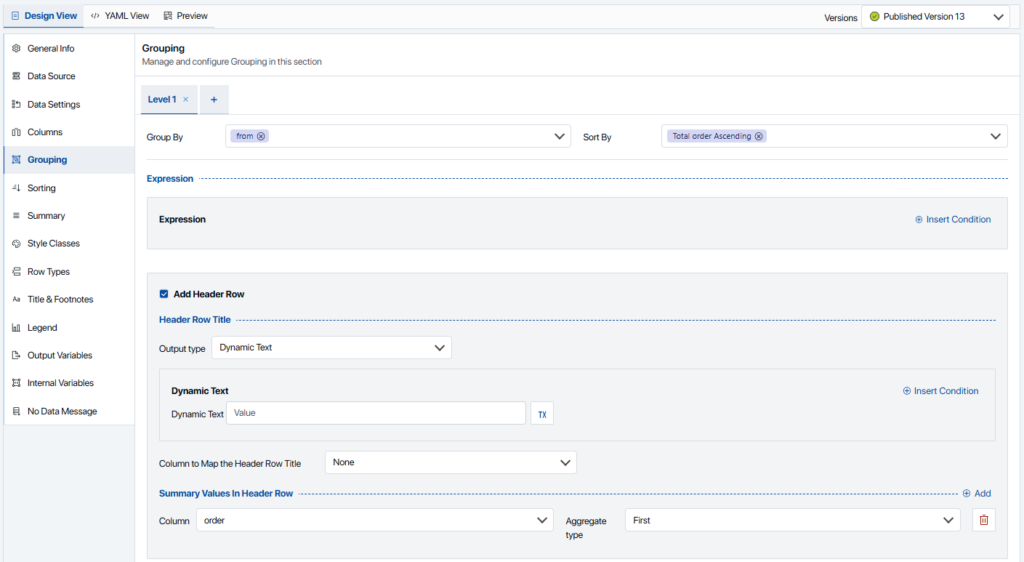
Grouping Tab #
To ensure that the columns and rows are properly matched when creating the Smart Shell, we will need to use the Grouping settings available in Data Object Editor.
Under the “Level 1” tab at the top of the screen add “from” in the “Group By” field and “Total order Ascending” in the “Sort By” field. Next, check the “Add Header Row” if not already done and set the “Output Type” to Dynamic Text”. Finally set “Column to Map the Header Row Title” to “None”. Set the “Column” and Aggregate Type” in the “Summary Value in Header Row” section to “order” and “First”, respectively.
Sorting Tab #
In the sorting tab, add “order Ascending” in the “Sort By” field under the “Level 1” tab. No further sorting is required.

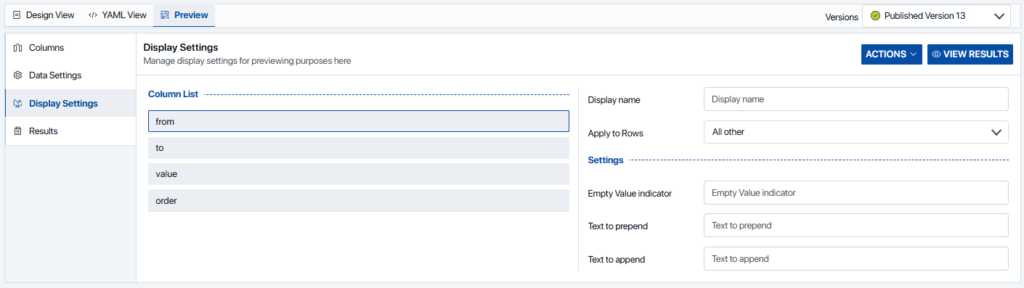
Preview the Data Object #
If you haven’t done so already, save the Data Object. If everything has been set up correctly, you should be able to preview the Data Object in the Preview Tab of the Data Object Editor. Add all columns in the Columns tab. Since the Data Object used in this example is static, we don’t actually need to set an account in the Data Settings tab— if you are using real data, you will need to select an account.
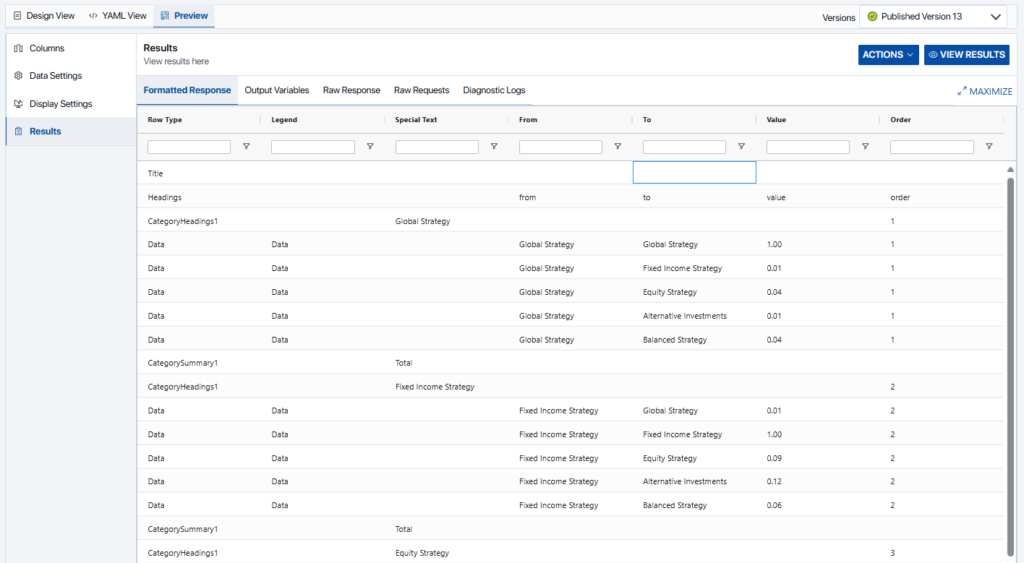
If everything has been set up correctly, the results should look like those below— note that the order column is used to sort (i.e., 1,2,3…) and that the strategies in the “from” column repeat for each group and that the strategies in the “to” column are always in the same order. Also note the placement of CategoryHeading1 this is important as this will be used to break/wrap the table in the next steps.
If everything looks correct, be sure to save and publish the Data Object for use in the next step
Correlation Matrix Smart Shell #
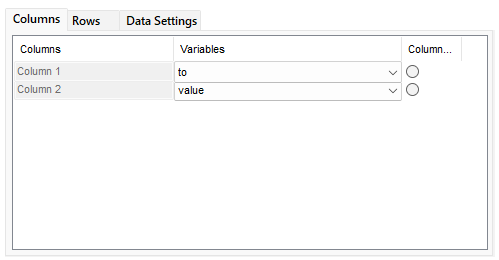
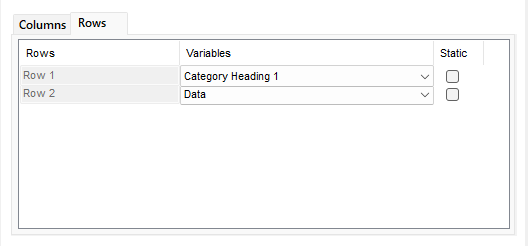
Start by opening a Smart Page or new Smart Shell. Next, create a 2×2 table and click on Fabricate & Edit button in the Assette Editor ribbon. the table and mapping the “to” and “value” as shown below (if desired, “from” can be used). Next, map the rows with “Category Heading 1” and “Data” as shown in the second image, below.
Smart Shell Advanced Settings #
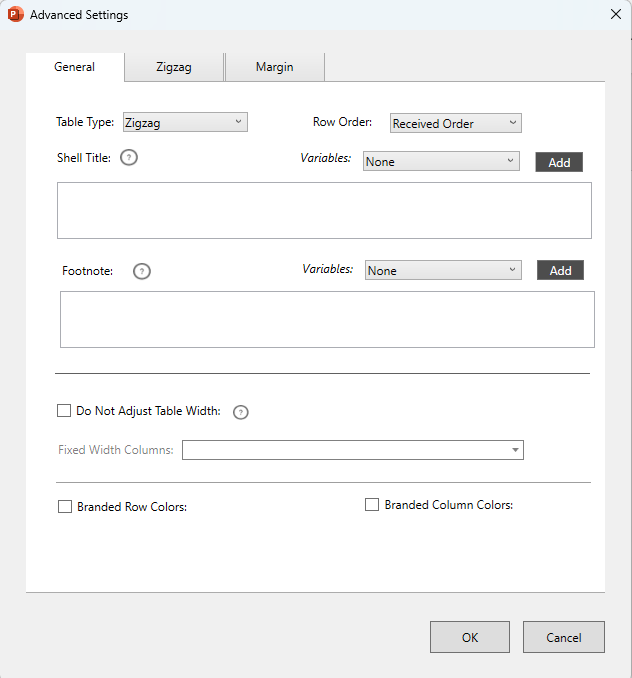
Next, click on Advanced Settings and set Table Type to “Zigzag” in the General Tab. Once set, click on the Zigzag Tab.
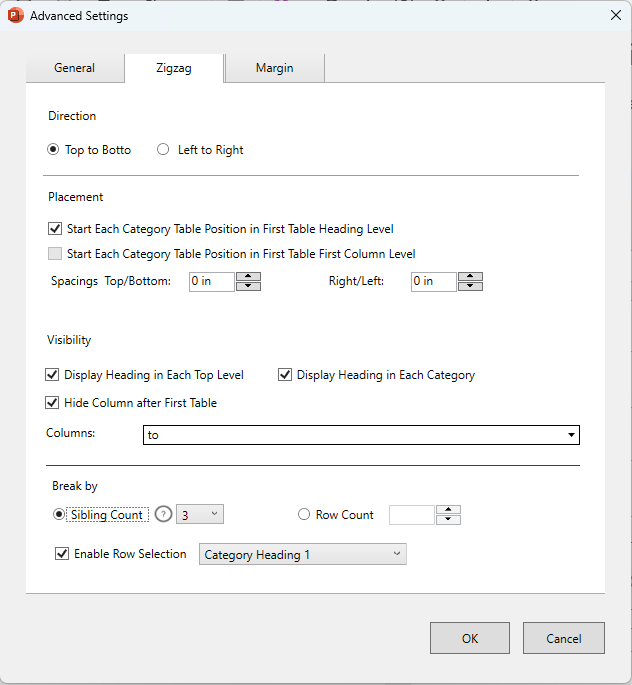
In the Zigzag Tab, the “Direction” should already be set to “Top to Bottom”. In the Placement section, check the box “Start Each Category Table Position in First Table Heading Level”. In the Visibility section, check all three options and set Columns field as “to”. Finally, check “Enable Row Selection” and set the field to “Category Heading 1” (Sibling Count should already be checked).
Preview & Publish #
Ensure that everything is working as intended by clicking on “Preview” in the Assette Editor Ribbon. If done correctly, the strategies should match up one-for-one. Once everything is working, close the preview and click Save and then Publish in the Assette Editor Ribbon.
